The hardware and bandwidth for this mirror is donated by dogado GmbH, the Webhosting and Full Service-Cloud Provider. Check out our Wordpress Tutorial.
If you wish to report a bug, or if you are interested in having us mirror your free-software or open-source project, please feel free to contact us at mirror[@]dogado.de.
Design-adjusted inference for pathogen lineage surveillance
under
unequal sequencing and reporting delays
![]()
Genomic surveillance systems sequence unevenly. Denmark sequences 12% of cases; Romania sequences 0.3%. If you estimate lineage prevalence by counting sequences, the result is dominated by Denmark — regardless of what is actually circulating across Europe.
On real ECDC data, this produces up to 14 percentage points of error:
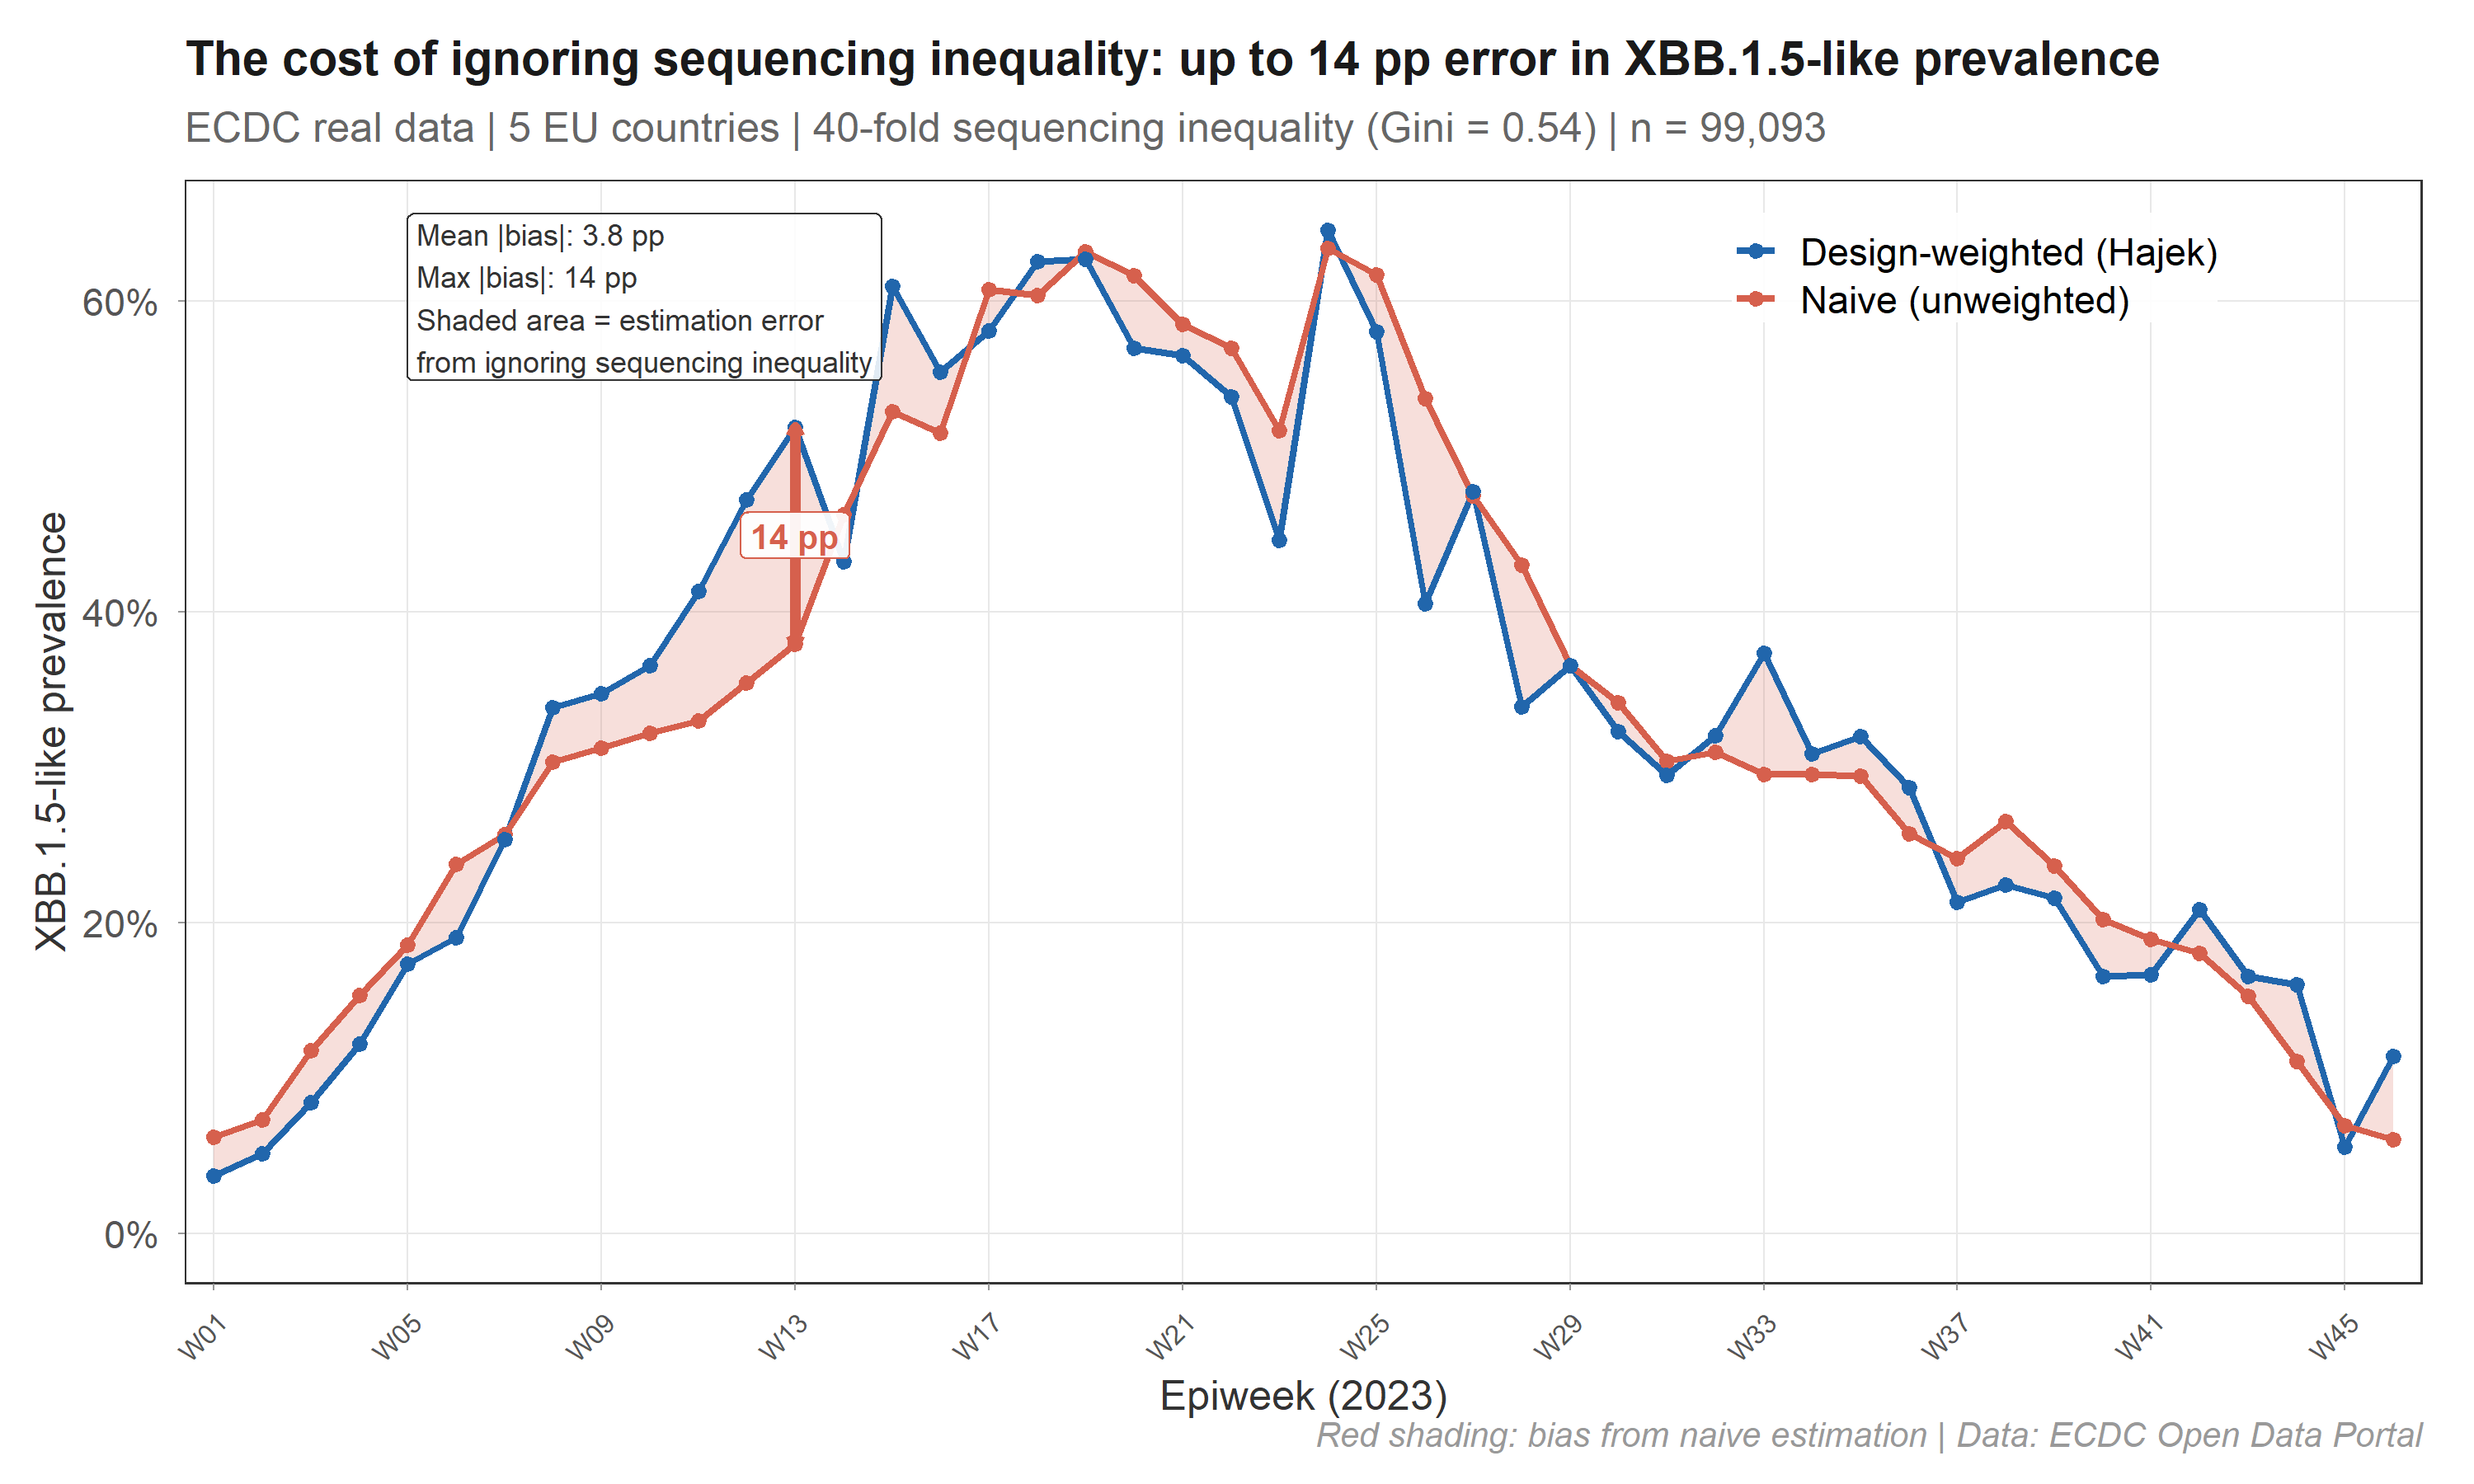
The red shaded area is the bias eliminated by design weighting. survinger corrects this using Horvitz-Thompson / Hajek estimators with Wilson score confidence intervals.
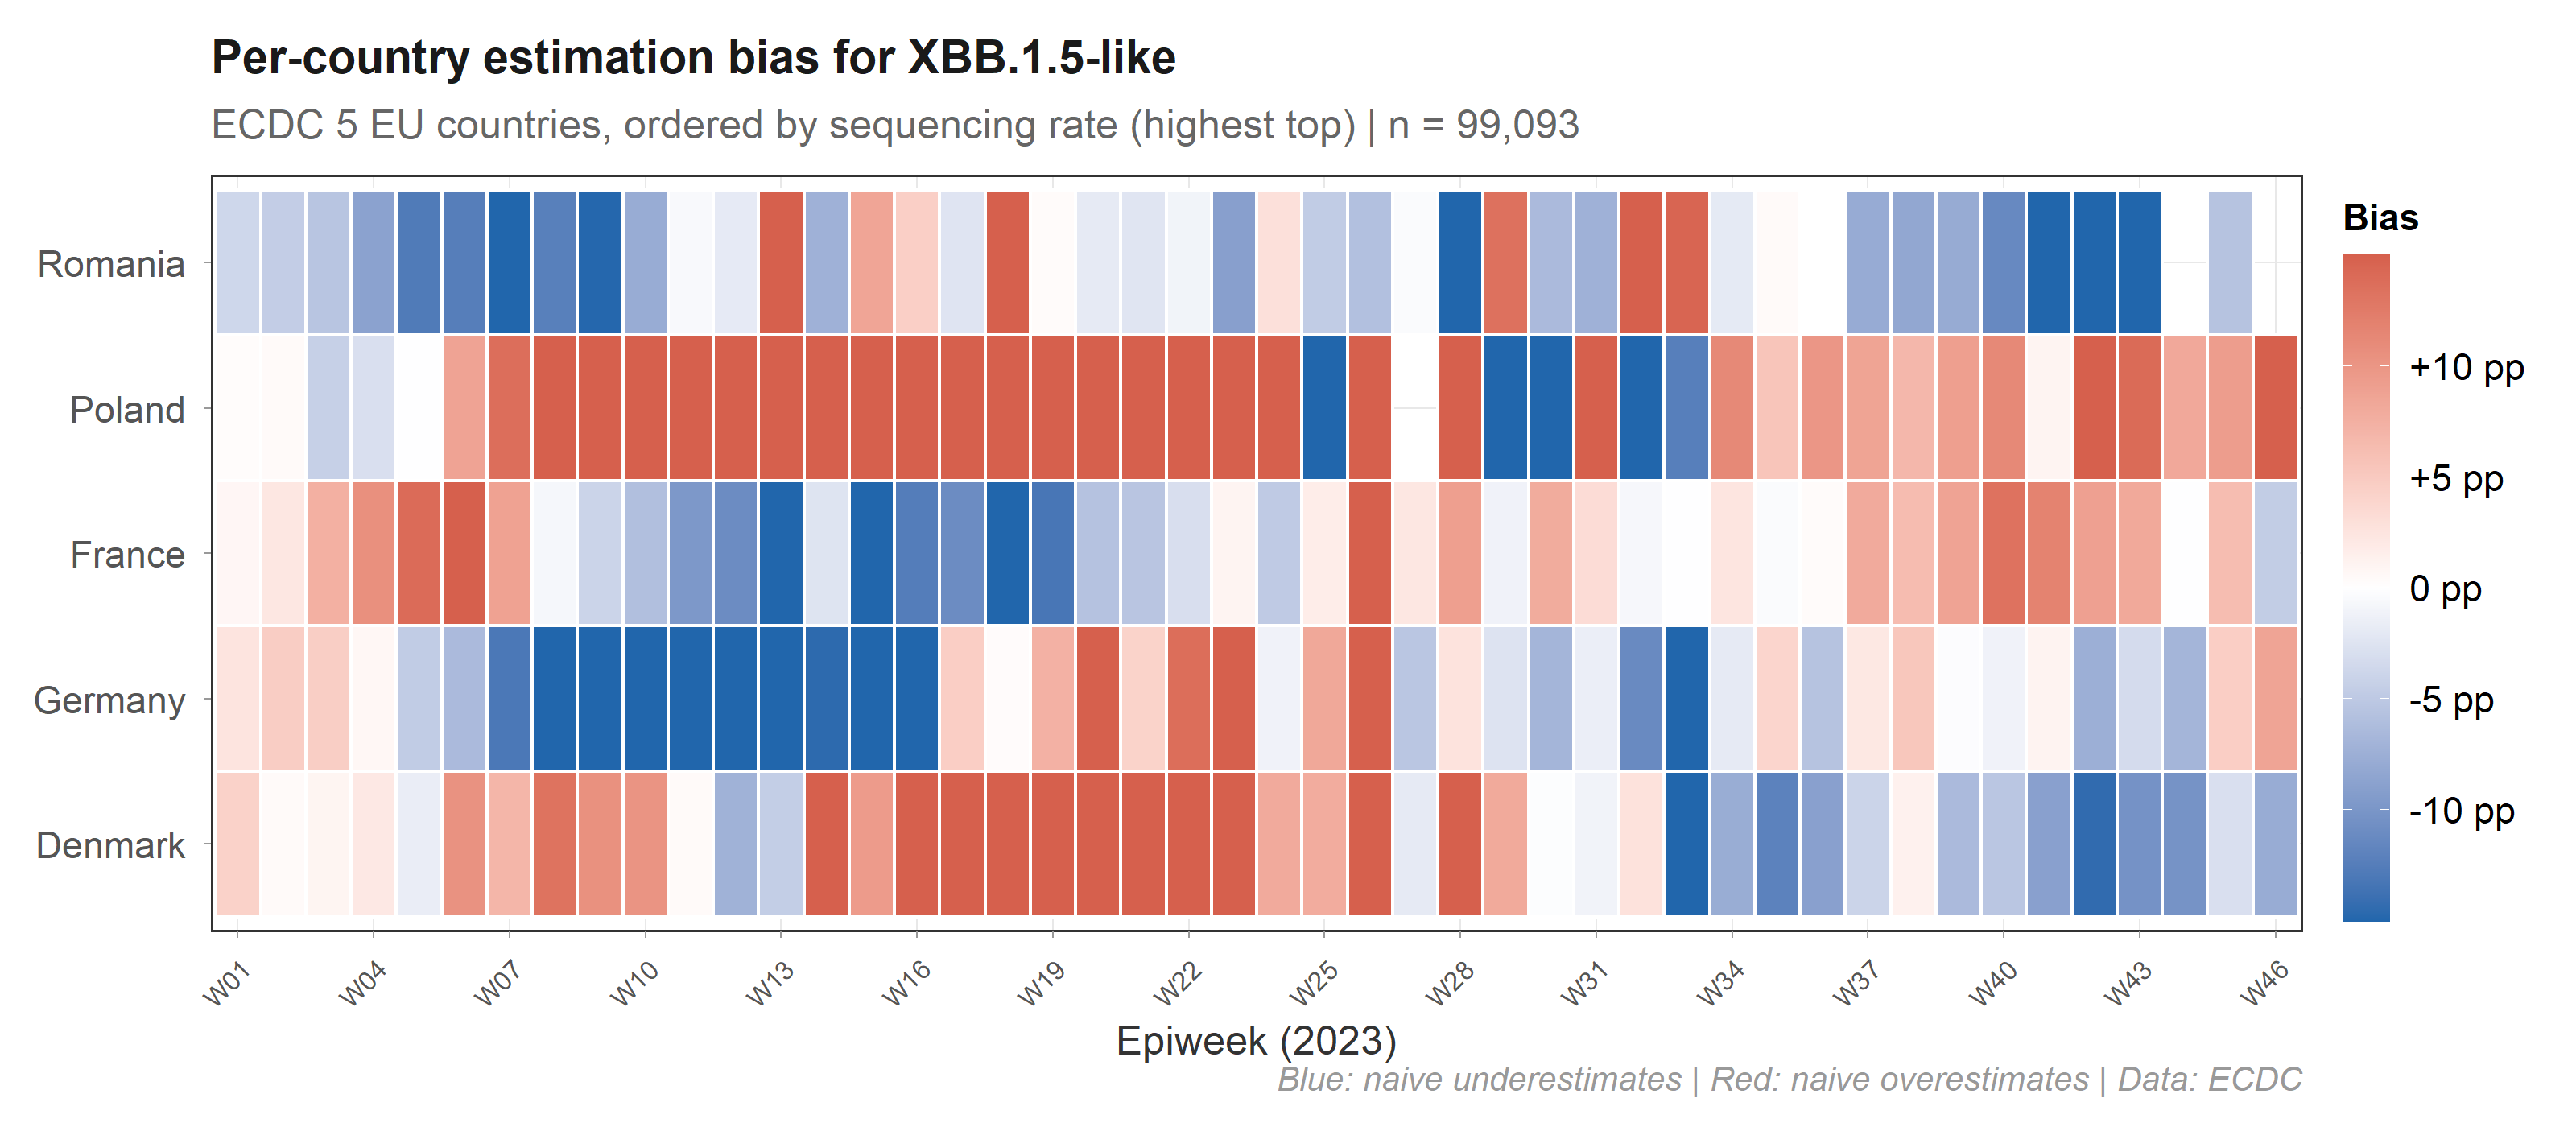
Each country’s bias depends on its sequencing rate and its local prevalence, and both change over time. Poland (under-sequenced, high prevalence) is systematically underweighted by naive methods. A single correction factor cannot fix this — you need per-stratum, per-period weights.
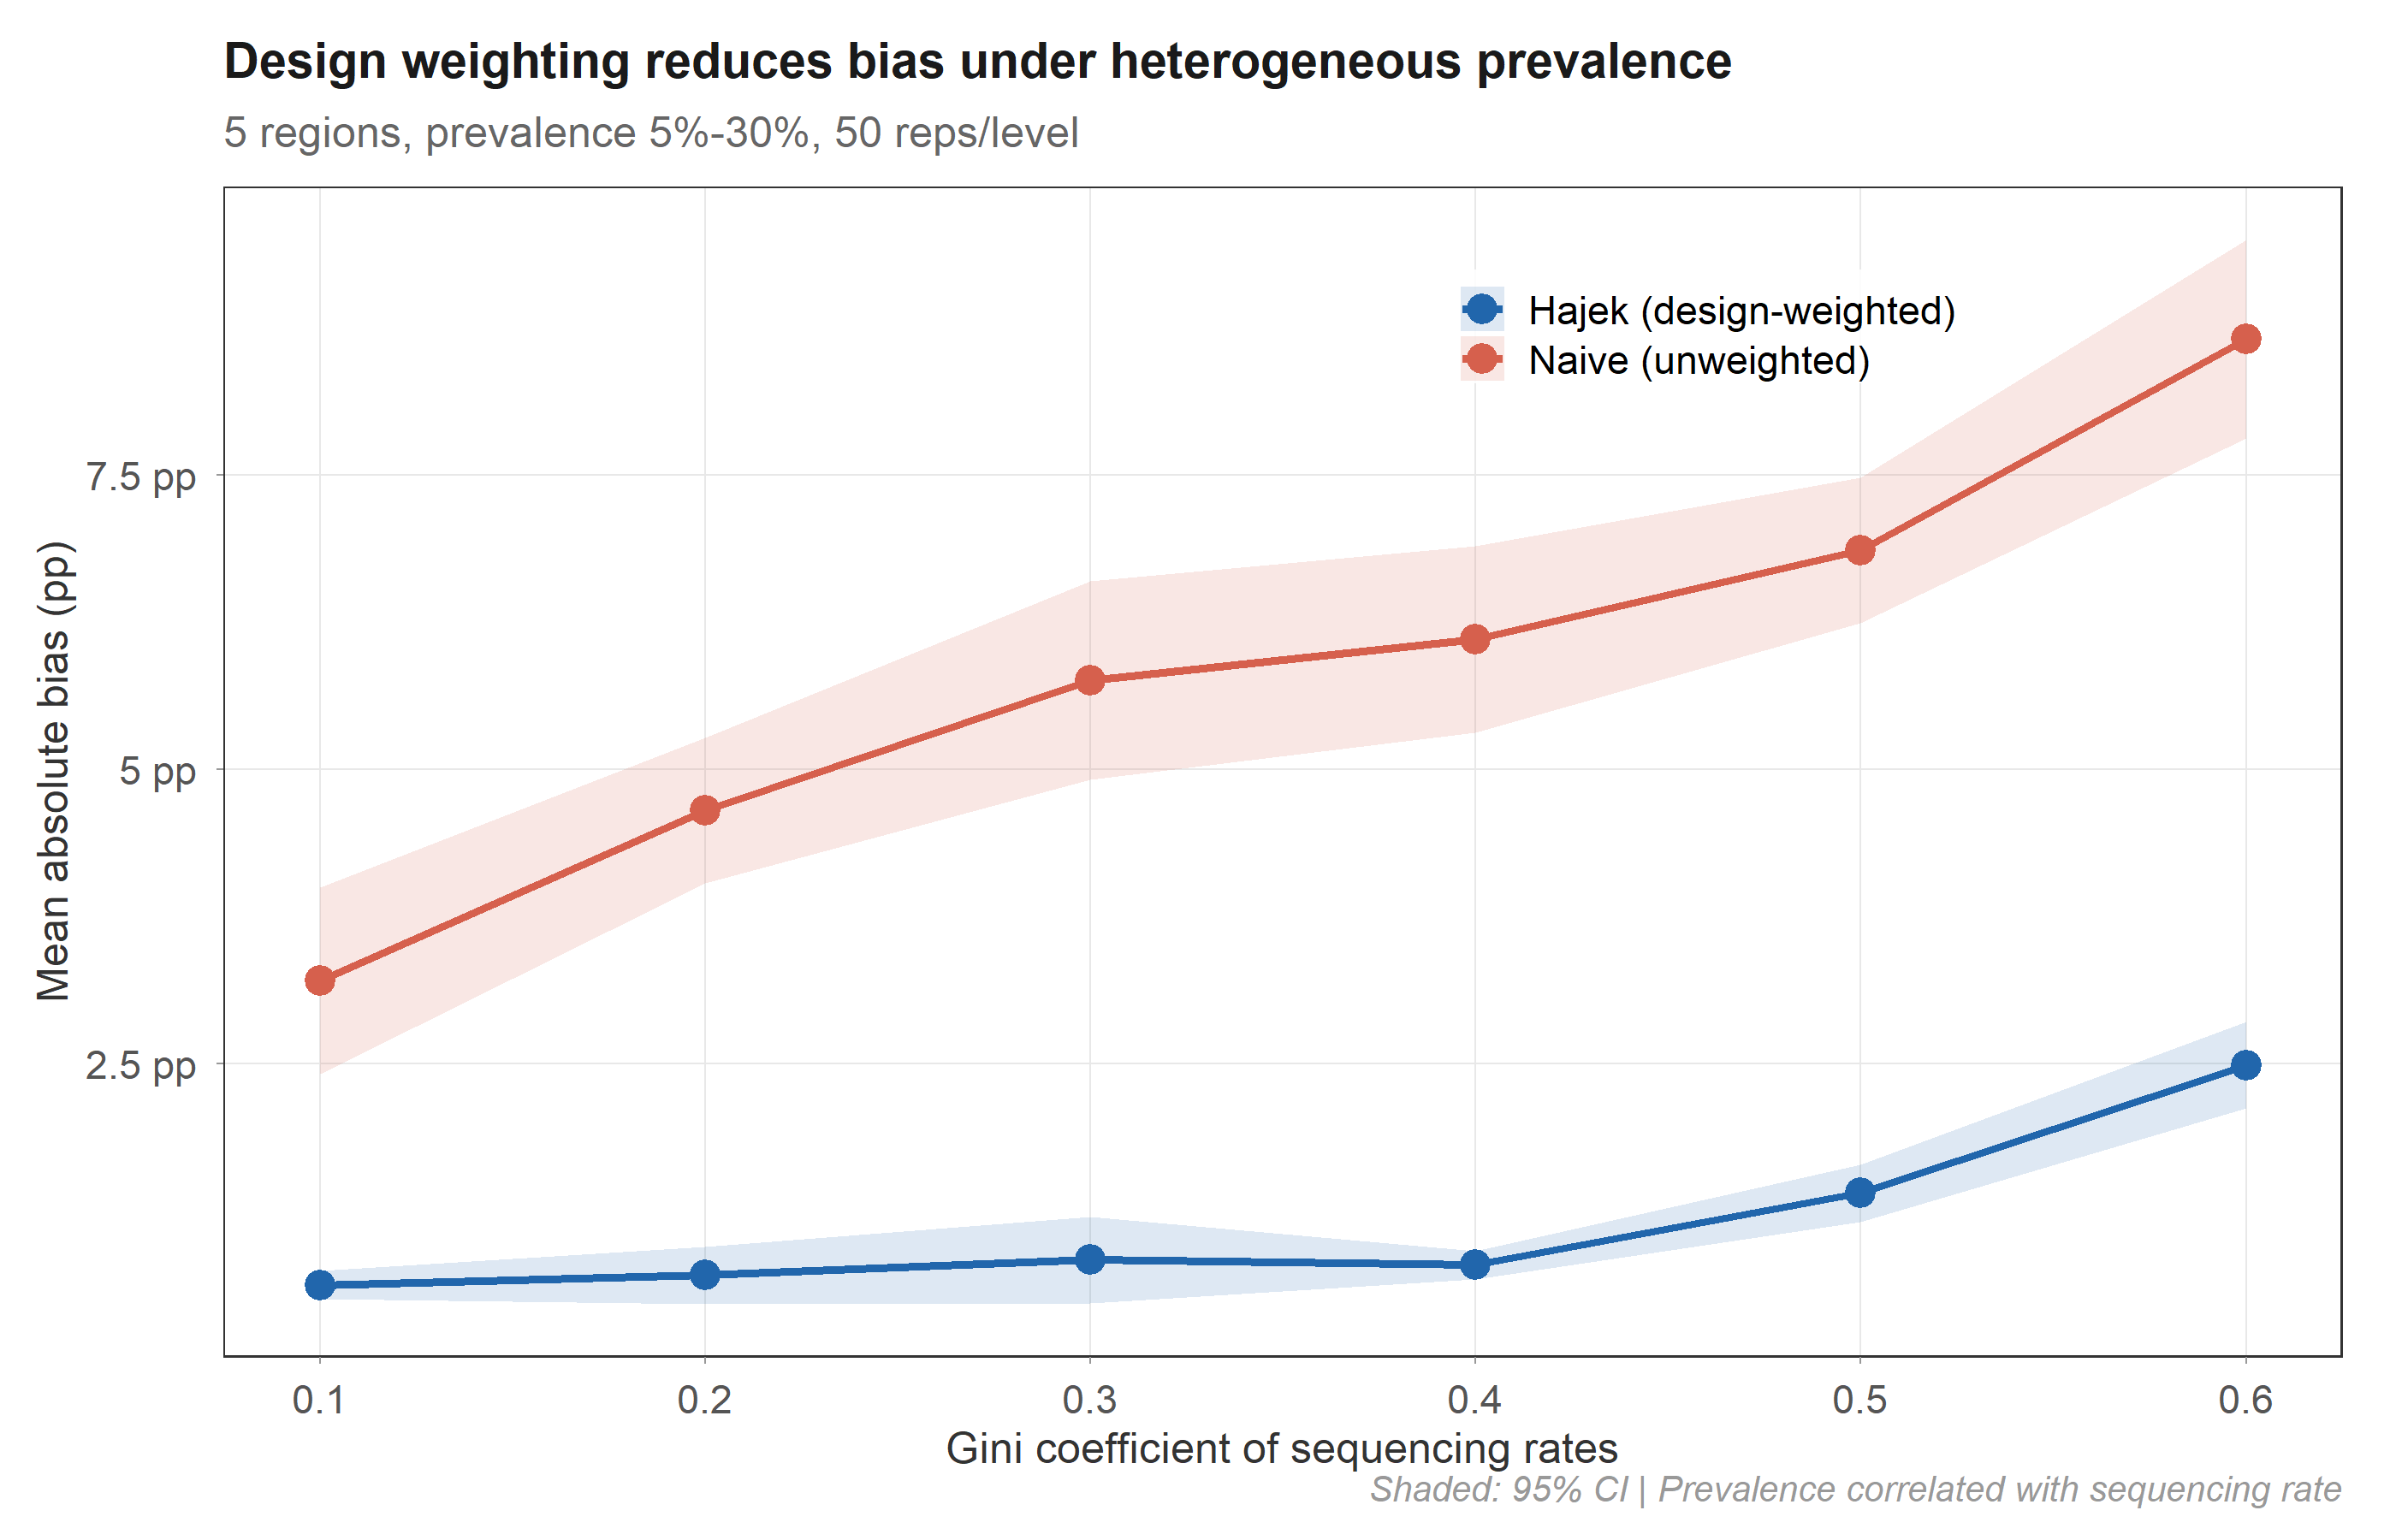
In controlled simulation (50 replicates × 6 inequality levels), the Hajek estimator maintains 0.6–2.5 pp absolute bias while the naive estimator reaches 3.2–8.7 pp. The advantage holds across all levels of sequencing inequality.
# install.packages("remotes")
remotes::install_github("CuiweiG/survinger")library(survinger)
# Simulate surveillance data (or use your own)
sim <- surv_simulate(n_regions = 5, n_weeks = 26, seed = 42)
# Create design from surveillance data
design <- surv_design(
data = sim$sequences, strata = ~ region,
sequencing_rate = sim$population[c("region", "seq_rate")],
population = sim$population
)
# Corrected prevalence (one line)
surv_lineage_prevalence(design, "BA.2.86")
# Or even simpler — single pipe-friendly call:
surv_estimate(
data = sim$sequences, strata = ~ region,
sequencing_rate = sim$population[c("region", "seq_rate")],
population = sim$population, lineage = "BA.2.86"
)
# Full pipeline with delay correction
delay <- surv_estimate_delay(design)
surv_adjusted_prevalence(design, delay, "BA.2.86")
# How should I allocate 500 sequences?
surv_optimize_allocation(design, "min_mse", total_capacity = 500)
# Is my system powerful enough?
surv_detection_probability(design, true_prevalence = 0.01)
# One-page diagnostic
surv_report(design)| Function | Purpose |
|---|---|
surv_design() |
Create design with inverse-probability weights |
surv_simulate() |
Generate synthetic surveillance data |
surv_filter() |
Subset a design by filter criteria |
surv_update_rates() |
Update sequencing rates |
surv_set_weights() |
Override design weights |
| Function | Purpose |
|---|---|
surv_lineage_prevalence() |
Hajek / HT / post-stratified prevalence |
surv_naive_prevalence() |
Unweighted baseline prevalence |
surv_prevalence_by() |
Prevalence by subgroup (region, source, etc.) |
surv_estimate() |
Pipe-friendly one-call analysis |
| Function | Purpose |
|---|---|
surv_estimate_delay() |
Right-truncation-corrected delay fitting |
surv_reporting_probability() |
Cumulative reporting probability |
surv_nowcast_lineage() |
Delay-adjusted nowcast |
surv_adjusted_prevalence() |
Combined design + delay correction |
| Function | Purpose |
|---|---|
surv_optimize_allocation() |
Neyman allocation (3 objectives) |
surv_compare_allocations() |
Benchmark all allocation strategies |
surv_required_sequences() |
Sample size for target detection power |
| Function | Purpose |
|---|---|
surv_detection_probability() |
Variant detection power |
surv_power_curve() |
Detection probability across prevalence range |
surv_compare_estimates() |
Weighted vs naive side-by-side plot |
surv_design_effect() |
Design effect over time |
surv_sensitivity() |
Sensitivity analysis across all methods |
surv_report() |
Surveillance system diagnostic |
surv_quality() |
One-row quality metrics |
| Function | Purpose |
|---|---|
tidy() / glance() |
Broom-style tidying for all result objects |
surv_bind() |
Combine multiple prevalence estimates |
surv_table() |
Publication-ready formatted table |
theme_survinger() |
Publication-quality ggplot2 theme |
| phylosamp | survey | epinowcast | survinger | |
|---|---|---|---|---|
| Question | How many? | General surveys | Bayesian nowcast | Allocate + correct + nowcast |
| Genomic-specific | ✓ | ✗ | Partial | ✓ |
| Allocation | ✗ | ✗ | ✗ | ✓ (3 objectives) |
| Delay correction | ✗ | ✗ | ✓ | ✓ |
| Requires Stan | ✗ | ✗ | ✓ | ✗ |
| CRAN-friendly | ✓ | ✓ | ✗ | ✓ |
survey::svymean (exact
match)vignette("survinger") — Quick startvignette("allocation-optimization") — Resource
allocationvignette("delay-correction") — Delay estimation and
nowcastingvignette("real-world-ecdc") — ECDC case study@Manual{survinger2026,
title = {survinger: Design-Adjusted Inference for Pathogen Lineage Surveillance},
author = {Cuiwei Gao},
year = {2026},
note = {R package version 0.1.0},
url = {https://github.com/CuiweiG/survinger}
}MIT © 2026 Cuiwei Gao
These binaries (installable software) and packages are in development.
They may not be fully stable and should be used with caution. We make no claims about them.
Health stats visible at Monitor.