The hardware and bandwidth for this mirror is donated by dogado GmbH, the Webhosting and Full Service-Cloud Provider. Check out our Wordpress Tutorial.
If you wish to report a bug, or if you are interested in having us mirror your free-software or open-source project, please feel free to contact us at mirror[@]dogado.de.
![]()
Acquire and Explore BEC-SMOS L4 Soil Moisture Data in R
The goal of smosr is to automate accessing, downloading
and exploring Soil Moisture and Ocean Salinity (SMOS) Level 4 (L4) data
developed by Barcelona Expert Center (BEC). Particularly, it includes
functions to search for, acquire, extract, and plot BEC-SMOS L4 soil
moisture data downscaled to ~1 km spatial resolution.
Install the released version of smosr from CRAN:
install.packages("smosr")To get a bug fix or to use the newest features of the package,
install the development version of smosr from GitHub:
# install.packages("devtools")
devtools::install_github("tshestakova/smosr")library(smosr)
# # to set credentials for accessing the BEC server
# # note that "username" and "password" should be replaced with your login details
# set_credentials("username", "password")
# to search for BEC-SMOS data with the specified parameters available on the server
start_date <- as.Date("2010-07-15")
end_date <- as.Date("2022-07-15")
date_range <- seq(start_date, end_date, by = 365)
smos_data <- find_smos(freq = 3, orbit = "des", dates = date_range)
#> Done. All requested files were successfully found.
# to download the data from the server to a temporary directory in a local computer
download_smos(data = smos_data)
#> |================================================================================| 100%
# to list all BEC-SMOS data files currently stored in the temporary directory
smos_files <- list_smos()
head(smos_files, 5)
#> [1] "C:/Users/.../Temp/RtmpInOFOr/BEC_SM____SMOS__EUM_L4__D_20100715T183618_001km_3d_REP_v6.0.nc"
#> [2] "C:/Users/.../Temp/RtmpInOFOr/BEC_SM____SMOS__EUM_L4__D_20110715T182802_001km_3d_REP_v6.0.nc"
#> [3] "C:/Users/.../Temp/RtmpInOFOr/BEC_SM____SMOS__EUM_L4__D_20120714T182030_001km_3d_REP_v6.0.nc"
#> [4] "C:/Users/.../Temp/RtmpInOFOr/BEC_SM____SMOS__EUM_L4__D_20130714T181231_001km_3d_REP_v6.0.nc"
#> [5] "C:/Users/.../Temp/RtmpInOFOr/BEC_SM____SMOS__EUM_L4__D_20140714T180441_001km_3d_REP_v6.0.nc"
# to extract soil moisture estimates for the specified geographical locations
# from the list of data files obtained in the previous steps
lat <- c(38.72, 41.90, 48.86, 52.50, 59.44)
lon <- c(-9.14, 12.50, 2.35, 13.40, 24.75)
sm_estimates <- extract_smos(data = smos_files, lat = lat, lon = lon)
#> |================================================================================| 100%
head(sm_estimates, 12)
#> Lat Lon Freq Orbit Date Time SM QA
#> [1,] "38.72" "-9.14" "3d" "D" "2010-07-15" "20:36:18" "0.0176999995528604" "5"
#> [2,] "41.9" "12.5" "3d" "D" "2010-07-15" "20:36:18" "0.0872999977946165" "7"
#> [3,] "48.86" "2.35" "3d" "D" "2010-07-15" "20:36:18" "0.206299994788424" "2"
#> [4,] "52.5" "13.4" "3d" "D" "2010-07-15" "20:36:18" "0.191299995167356" "6"
#> [5,] "59.44" "24.75" "3d" "D" "2010-07-15" "20:36:18" "0.165999995806487" "7"
#> [6,] "38.72" "-9.14" "3d" "D" "2011-07-15" "20:28:02" "0.071999998181127" "3"
#> [7,] "41.9" "12.5" "3d" "D" "2011-07-15" "20:28:02" "0.025399999358342" "7"
#> [8,] "48.86" "2.35" "3d" "D" "2011-07-15" "20:28:02" "0.0235999994038139" "6"
#> [9,] "52.5" "13.4" "3d" "D" "2011-07-15" "20:28:02" "0.0769999980548164" "2"
#> [10,] "59.44" "24.75" "3d" "D" "2011-07-15" "20:28:02" "0.144699996344571" "7"
#> [11,] "38.72" "-9.14" "3d" "D" "2012-07-14" "20:20:31" "0.0246999993760255" "5"
#> [12,] "41.9" "12.5" "3d" "D" "2012-07-14" "20:20:31" "0.000499999987368938" "7"
# to plot extracted temporal series of soil moisture data
plot_temporal_smos(data = sm_estimates)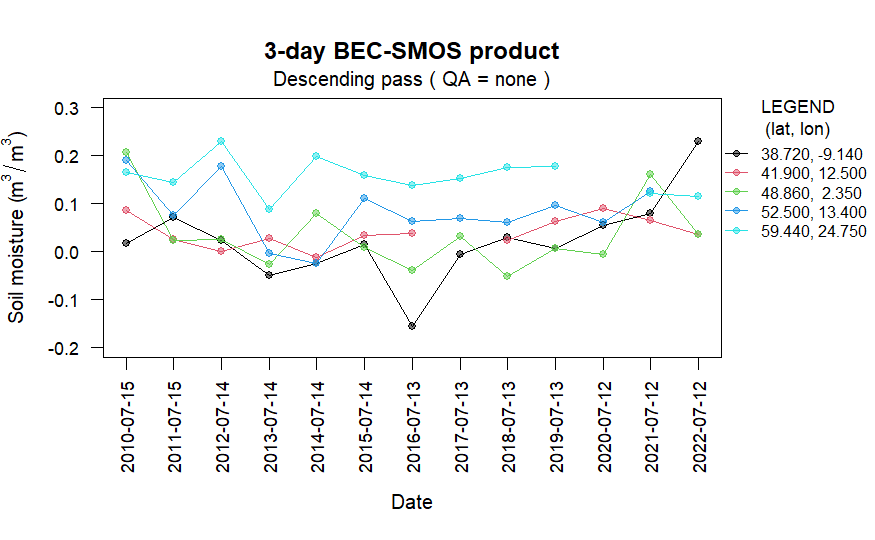
# to draw a raster image of soil moisture estimates from a file with
# desired data quality and within the specified geographical bounds
lat <- c(35.00, 45.00)
lon <- c(-10.50, 4.50)
plot_raster_smos(data = smos_files[13], lat = lat, lon = lon, QA = c(0,1,2,3))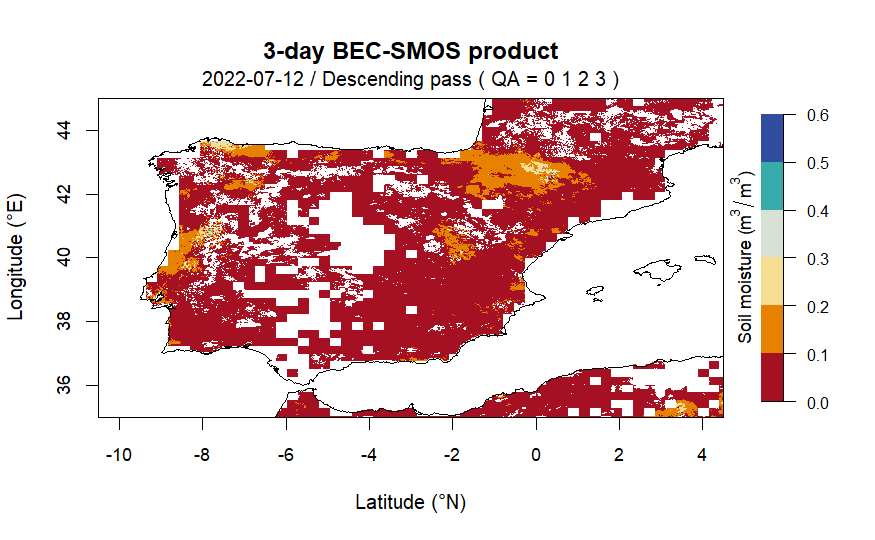
If you encounter a clear bug, please file an issue with a minimal reproducible example on GitHub.
For questions and other discussion, please use Stack Overflow and the RStudio community.
These binaries (installable software) and packages are in development.
They may not be fully stable and should be used with caution. We make no claims about them.
Health stats visible at Monitor.