
The hardware and bandwidth for this mirror is donated by dogado GmbH, the Webhosting and Full Service-Cloud Provider. Check out our Wordpress Tutorial.
If you wish to report a bug, or if you are interested in having us mirror your free-software or open-source project, please feel free to contact us at mirror[@]dogado.de.
The great pivottabler
package enables pivot tables to be created with just a few lines of
R.
The pivottabler package aims to:
All calculations for the pivot tables take place inside R, enabling the use of a wide-range of R functions in the calculation logic, and are optimized with the use of packages dplyr & data.table
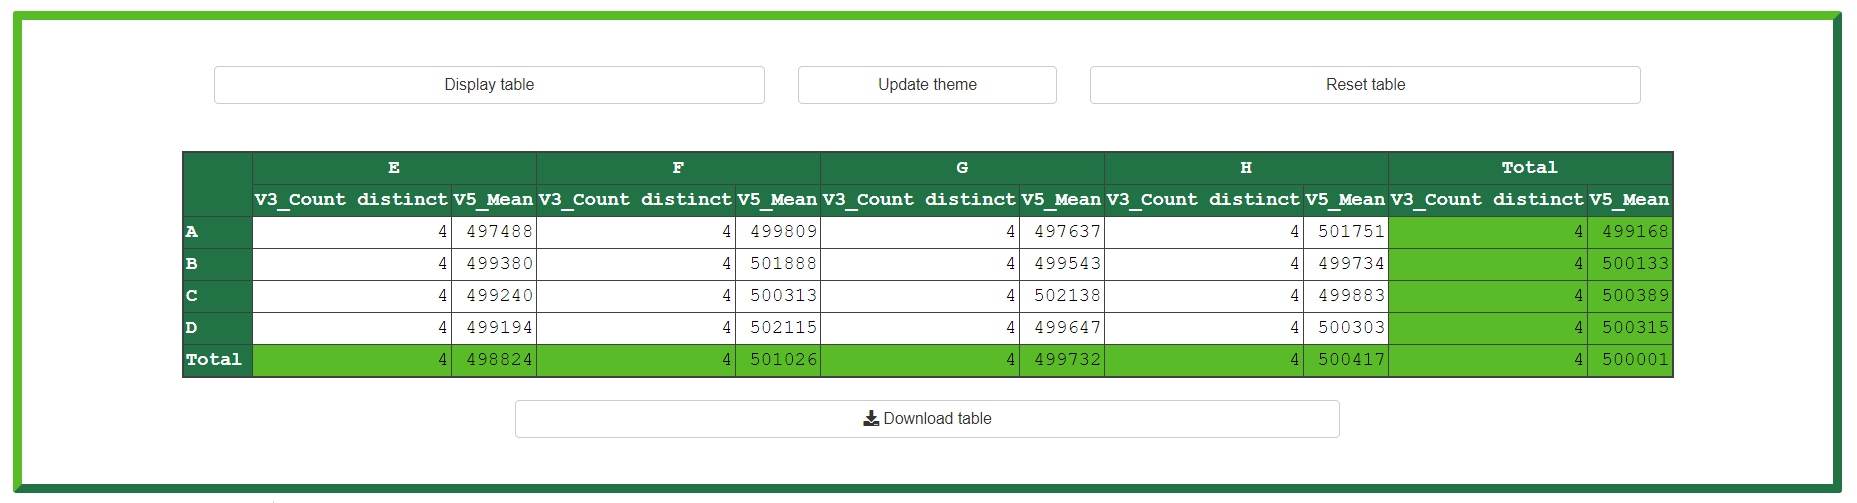
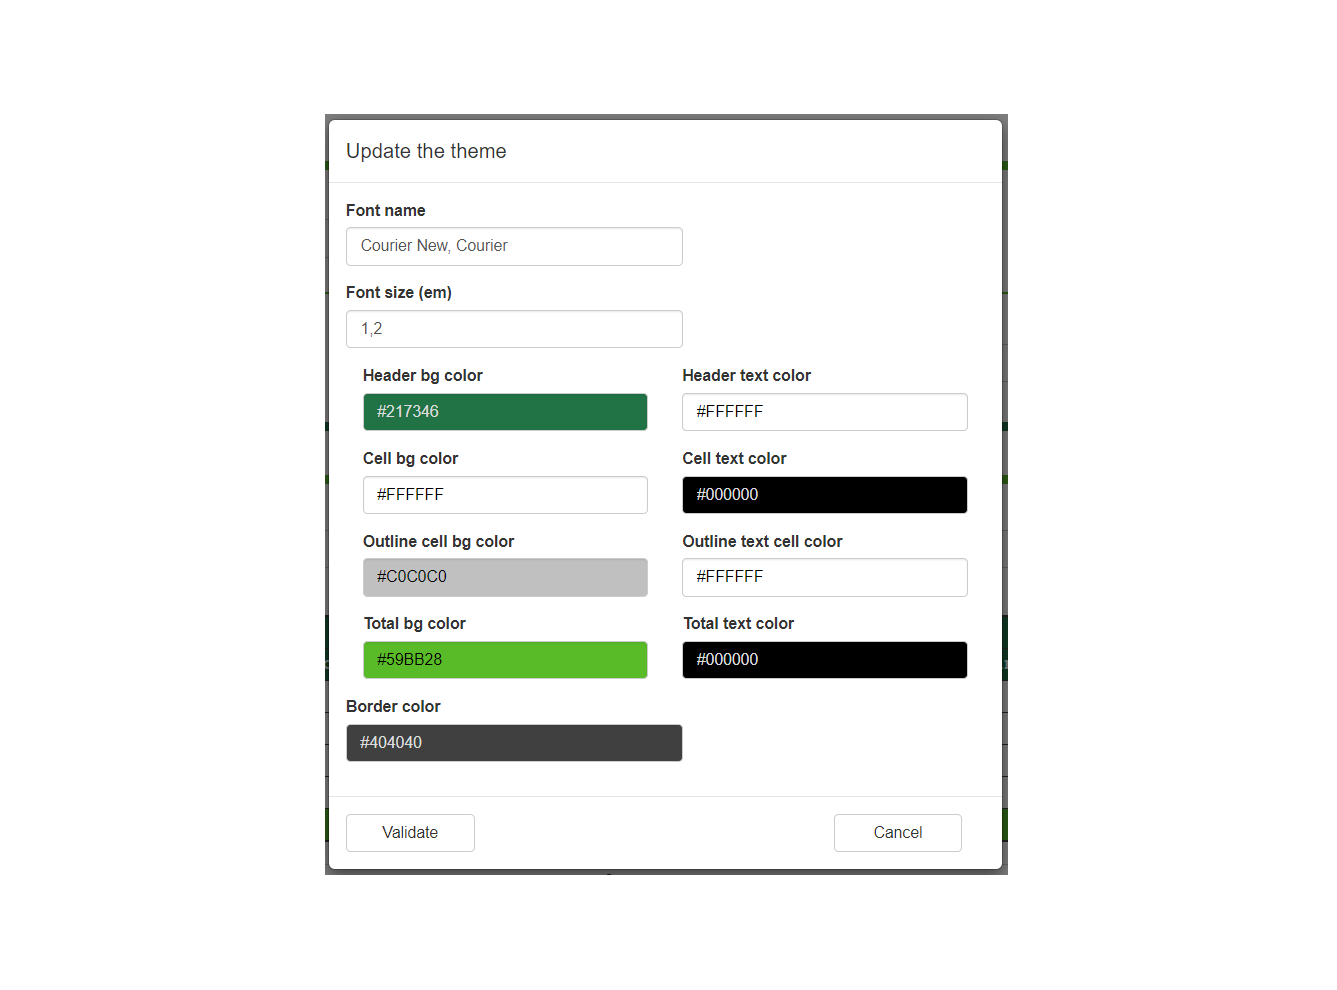
shinypivottabler just adds a simple and useful Shiny
module to build, visualize, customize and export custom pivot
tables.
The rpivotTable
package is visualization library built around the Javascript pivottable library.
PivotTable.js is a Javascript Pivot Table library with
drag’n’drop functionality built on top of jQuery/jQueryUI and written in
CoffeeScript (then compiled to JavaScript) by Nicolas Kruchten at
Datacratic. It is available under an MIT license
rpivotTable is really a great pivot table library with
some really cool features such as :
But it’s a full Javascript tool, and so all the data are
sended to the client, and all computations are done on the client. So
it’s not a good idea to use rpivotTable with a huge
database.
No charts (yet…?) in shinypivottabler but :
You can install:
devtools::install_github("datastorm-open/shinypivottabler")online
https://datastorm-demo.shinyapps.io/shinypivottabler/
local
runApp(system.file("demo_app", package = "shinypivottabler"))require(shinypivottabler)
n <- 10000000
# create artificial dataset
data <- data.frame("gr1" = sample(c("A", "B", "C", "D"), size = n,
prob = rep(1, 4), replace = T),
"gr2" = sample(c("E", "F", "G", "H"), size = n,
prob = rep(1, 4), replace = T),
"gr3" = sample(c("I", "J", "K", "L"), size = n,
prob = rep(1, 4), replace = T),
"gr4" = sample(c("M", "N", "O", "P"), size = n,
prob = rep(1, 4), replace = T),
"value1" = rnorm(n),
"value2" = runif(n))
server = function(input, output, session) {
shiny::callModule(module = shinypivottabler,
id = "id",
data = data,
pivot_cols = c("gr1", "gr2", "gr3", "gr4"))
}
ui = shiny::fluidPage(
shinypivottablerUI(id = "id")
)
shiny::shinyApp(ui = ui, server = server)
# more info in documentation :
?shinypivottabler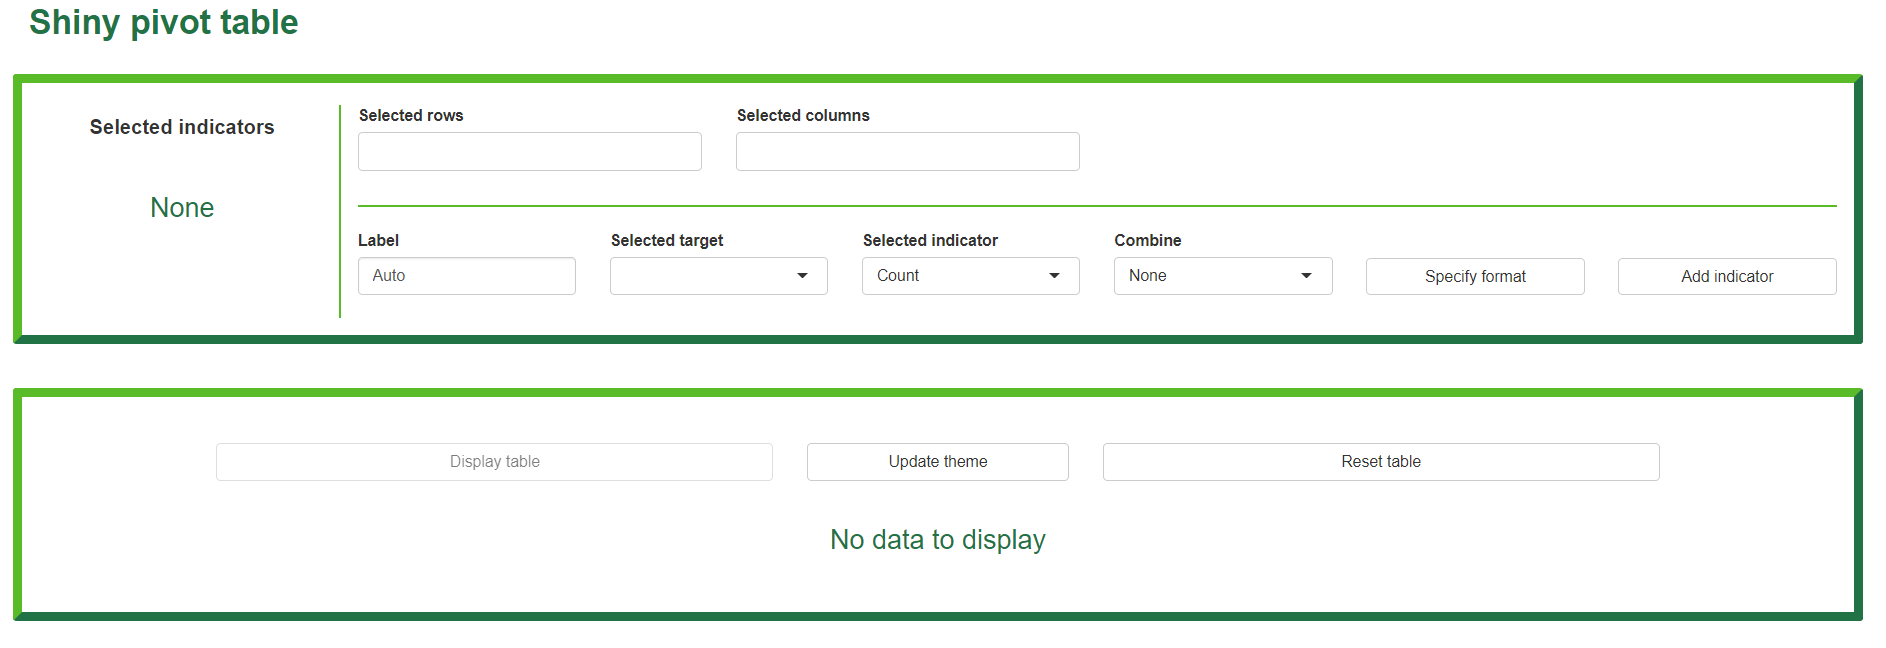
These binaries (installable software) and packages are in development.
They may not be fully stable and should be used with caution. We make no claims about them.
Health stats visible at Monitor.