The hardware and bandwidth for this mirror is donated by dogado GmbH, the Webhosting and Full Service-Cloud Provider. Check out our Wordpress Tutorial.
If you wish to report a bug, or if you are interested in having us mirror your free-software or open-source project, please feel free to contact us at mirror[@]dogado.de.
![]()
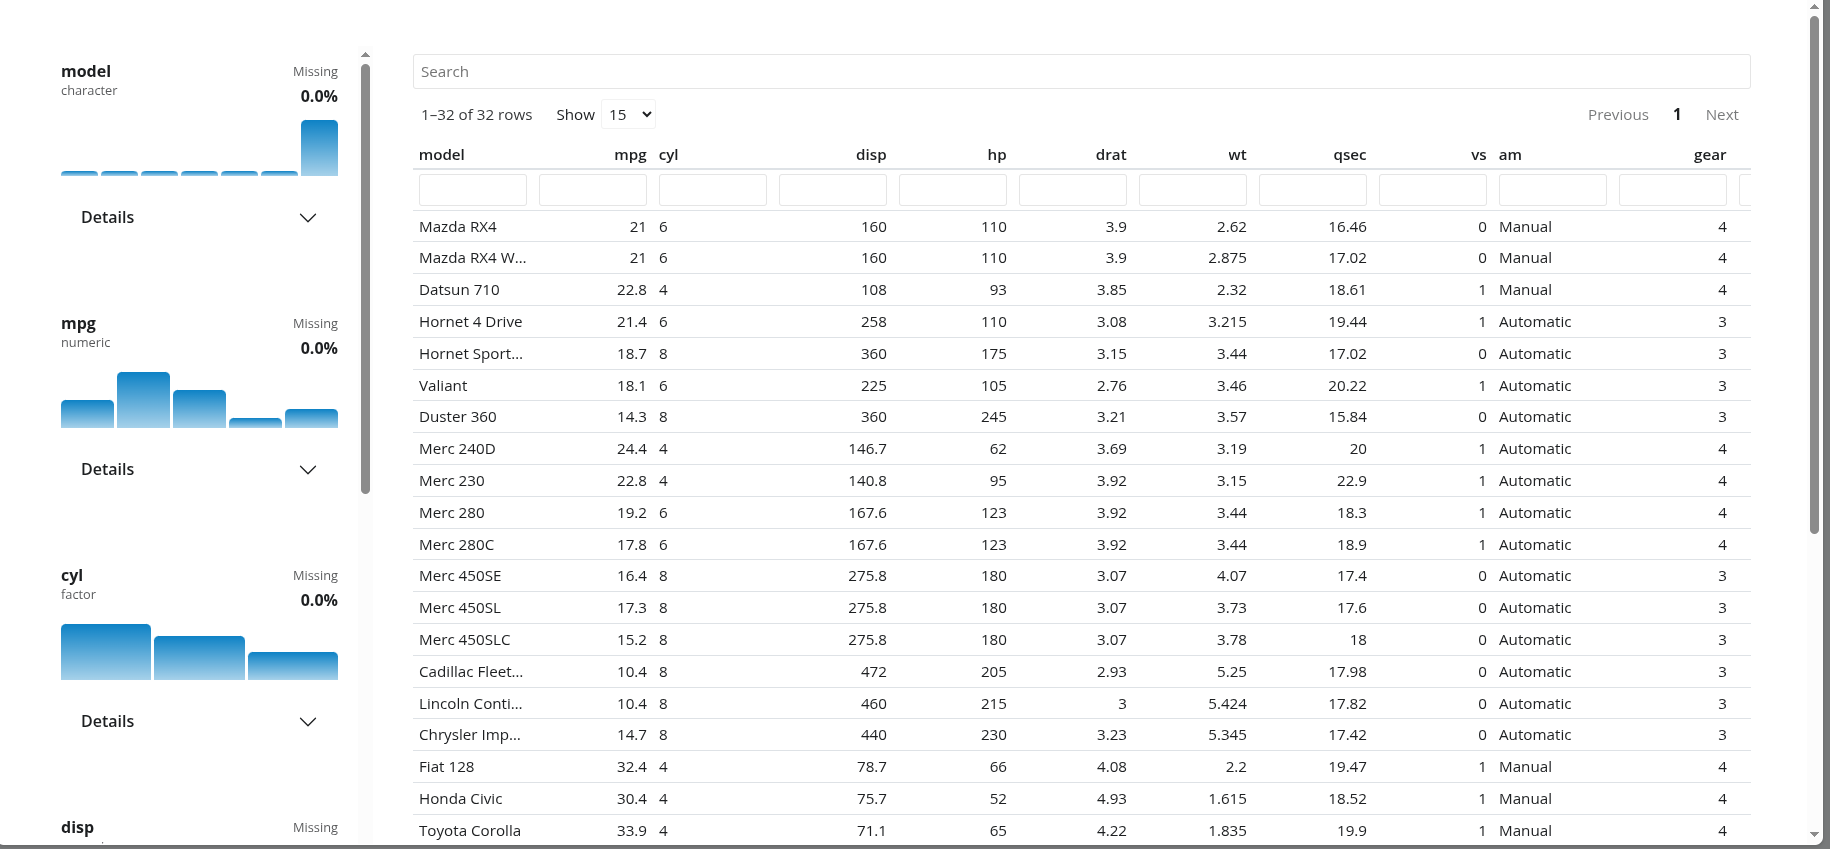
shinydataviewer provides a reusable Shiny module for
viewing tabular data with a searchable table and a variable summary
sidebar inspired by the Positron data viewer.
Install shinydataviewer from CRAN:
install.packages("shinydataviewer")You can install the development version from GitHub:
pak::pak("Ryan-W-Harrison/shinydataviewer")shinydataviewer is designed to be used as a reusable
Shiny module. The main exported functions are:
data_viewer_ui(id)data_viewer_server(id, data)data_viewer_card_ui(id, title = NULL)summarize_columns(df)data should be a reactive expression that returns a
data.frame. Supported column classes are numeric, integer,
character, factor, logical, Date, and
POSIXct/POSIXt.
Use the module directly when you want the viewer layout to manage its own main table region:
library(shiny)
library(bslib)
library(shinydataviewer)

ui <- page_fillable(
  theme = bs_theme(version = 5),
  data_viewer_ui("viewer")
)

server <- function(input, output, session) {
  data_viewer_server(
    "viewer",
    data = reactive(iris)
  )
}

shinyApp(ui, server)Use data_viewer_card_ui() when the viewer needs to live
inside a larger dashboard or reporting layout:
library(shiny)
library(bslib)
library(shinydataviewer)

ui <- page_fillable(
  theme = bs_theme(version = 5),
  layout_columns(
    col_widths = c(4, 8),
    card(
      card_header("Context"),
      card_body("Supporting content goes here.")
    ),
    card(
      card_header("Dataset"),
      card_body(
        fill = TRUE,
        data_viewer_card_ui("viewer", title = NULL, full_screen = FALSE)
      )
    )
  )
)

server <- function(input, output, session) {
  data_viewer_server(
    "viewer",
    data = reactive(mtcars)
  )
}

shinyApp(ui, server)
An additional runnable example is included at
inst/examples/embedded-card-example.R.
The viewer styles are attached as a package dependency and use
Bootstrap 5 theme variables instead of fixed colors. In practice, that
means the module will follow the active bslib theme and
should pick up branding supplied through bs_theme() or a
brand.yml-driven theme without additional module-specific
configuration.
ui <- page_fillable(
  theme = bs_theme(
    version = 5,
    brand = "brand.yml"
  ),
  data_viewer_card_ui("viewer")
)If you want access to the same summary data used by the module’s
variable panel, you can call summarize_columns()
directly:
summarize_columns(iris)The returned data frame has one row per input column. Its
summary_stats and distribution_data
list-columns contain the same precomputed payloads used by the sidebar
cards, including compact statistics, histogram bins, and top-level
categorical counts.
These binaries (installable software) and packages are in development.
They may not be fully stable and should be used with caution. We make no claims about them.
Health stats visible at Monitor.