The hardware and bandwidth for this mirror is donated by dogado GmbH, the Webhosting and Full Service-Cloud Provider. Check out our Wordpress Tutorial.
If you wish to report a bug, or if you are interested in having us mirror your free-software or open-source project, please feel free to contact us at mirror[@]dogado.de.
![]()
![]()
{shapviz} provides typical SHAP plots:
sv_importance(): Importance plot (bar/beeswarm).sv_dependence() and sv_dependence2D():
Dependence plots to study feature effects and interactions.sv_interaction(): Interaction plot (beeswarm/bar).sv_waterfall(): Waterfall plot to study single or
average predictions.sv_force(): Force plot as alternative to waterfall
plot.SHAP and feature values are stored in a “shapviz” object that is built from:
We use {patchwork} to glue together multiple plots with (potentially) inconsistent x and/or color scale.
# From CRAN
install.packages("shapviz")

# Or the newest version from GitHub:
# install.packages("devtools")
devtools::install_github("ModelOriented/shapviz")Shiny diamonds… let’s use XGBoost to model their prices by the four “C” variables:
library(shapviz)
library(ggplot2)
library(xgboost)
set.seed(1)
xvars <- c("log_carat", "cut", "color", "clarity")
X <- diamonds |>
transform(log_carat = log(carat)) |>
subset(select = xvars)
# Fit (untuned) model
fit <- xgb.train(
params = list(learning_rate = 0.1),
data = xgb.DMatrix(data.matrix(X), label = log(diamonds$price)),
nrounds = 65
)
# SHAP analysis: X can even contain factors
X_explain <- X[sample(nrow(X), 2000), ]
shp <- shapviz(fit, X_pred = data.matrix(X_explain), X = X_explain)
sv_importance(shp, show_numbers = TRUE)
sv_importance(shp, kind = "bee")
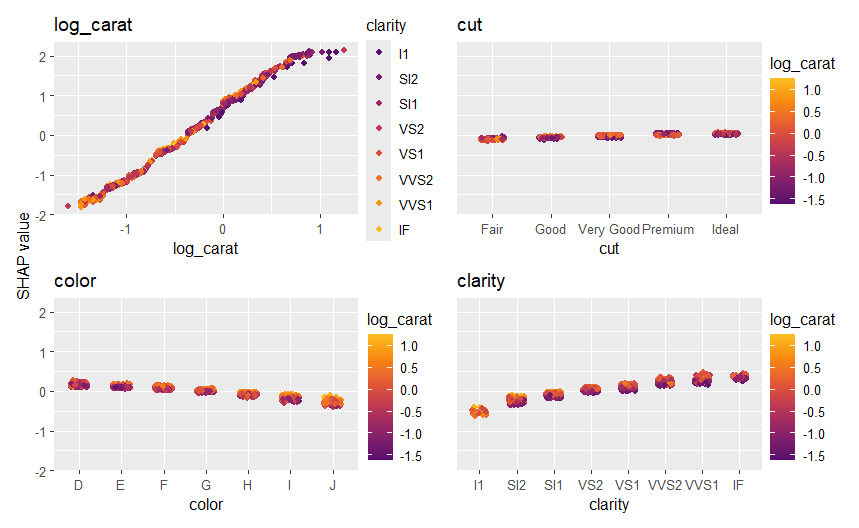
sv_dependence(shp, v = xvars, share_y = TRUE)

Decompositions of individual predictions can be visualized as waterfall or force plot:
sv_waterfall(shp, row_id = 2) +
  ggtitle("Waterfall plot for second prediction")

sv_force(shp, row_id = 2) +
  ggtitle("Force plot for second prediction")

Check-out the vignettes for topics like:
[1] Scott M. Lundberg and Su-In Lee. A Unified Approach to Interpreting Model Predictions. Advances in Neural Information Processing Systems 30 (2017).
These binaries (installable software) and packages are in development.
They may not be fully stable and should be used with caution. We make no claims about them.
Health stats visible at Monitor.