
The hardware and bandwidth for this mirror is donated by dogado GmbH, the Webhosting and Full Service-Cloud Provider. Check out our Wordpress Tutorial.
If you wish to report a bug, or if you are interested in having us mirror your free-software or open-source project, please feel free to contact us at mirror[@]dogado.de.
R package for Creating Seasonality Plots of Stock Prices and Cryptocurrencies
The price action at any given time is determined by investor sentiment and market conditions. Although there is no established principle, over a long period of time, things often move with a certain periodicity. This is sometimes referred to as anomaly. The seasonPlot() function in this package calculates and visualizes the average value of price movements over a year for any given period. In addition, the monthly increase or decrease in price movement is represented with a colored background. This seasonPlot() function can use the same symbols as the ‘quantmod’ package (e.g. ^IXIC, ^DJI, SPY, BTC-USD, and ETH-USD etc).
1.3.1: Modify the “CryptoRSIheatmap” function (CRAN 4th version) and build the seasonalityPlot Web API on Huggingface Spaces.
1.2.1: Update seasonPlot & Add new function “CryptoRSIheatmap”.
1.1.1: Update Figures.
1.1.0: CRAN 3rd version.
1.0.1: CRAN 2nd version.
0.99.3: CRAN version.
0.99.1: Newly Published the GitHub.
install.packages("seasonalityPlot", repos="http://cran.r-project.org")type the code below in the R console window
install.packages("devtools", repos="http://cran.r-project.org")
library(devtools)
devtools::install_github("kumeS/seasonalityPlot")
or install from the source file with sh commands
git clone https://github.com/kumeS/seasonalityPlot.git
R CMD INSTALL seasonalityPlotseasonPlot: create seasonality plots for stock prices or cryptocurrencies
CryptoRSIheatmap: CryptoRSI Heatmap Function
library(seasonalityPlot)

#Plot an averaging seasonality of SPDR S&P500 ETF (SPY) between 2012 and 2022.
seasonPlot(Symbols="SPY")

#useAdjusted = TRUE
seasonPlot(Symbols="SPY", useAdjusted = TRUE)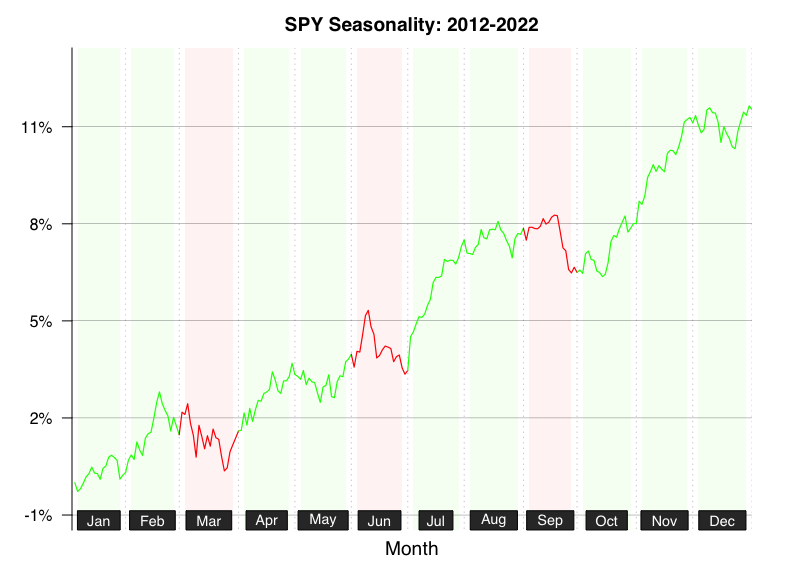
#Plot an averaging seasonality of Dow Jones Industrial Average (^DJI) between 2012 and 2022.
seasonPlot(Symbols="^DJI")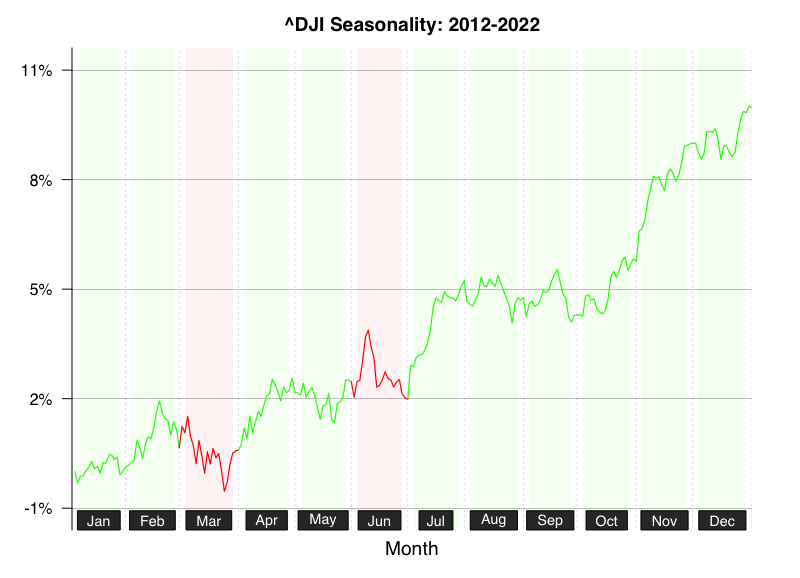
#Plot an averaging seasonality of NASDAQ Composite (^IXIC) between 2012 and 2022.
seasonPlot(Symbols="^IXIC")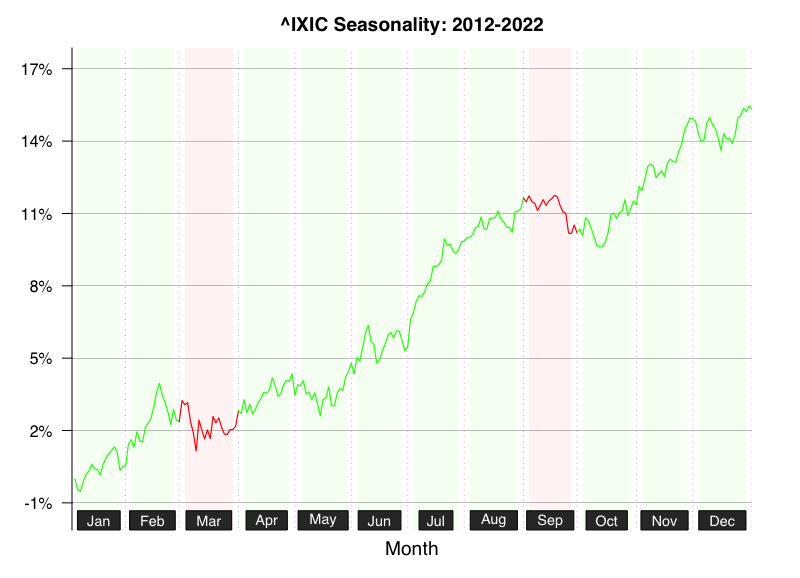
#Plot an averaging seasonality of Bitcoin (BTC-USD) between 2017 and 2022.
seasonPlot(Symbols="BTC-USD")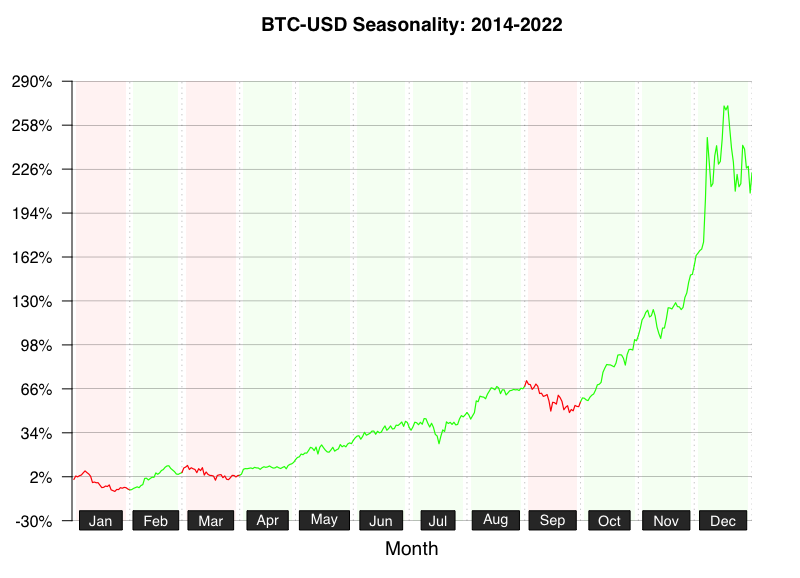
#Plot an averaging seasonality of Ethereum (ETH-USD) between 2017 and 2022.
seasonPlot(Symbols="ETH-USD")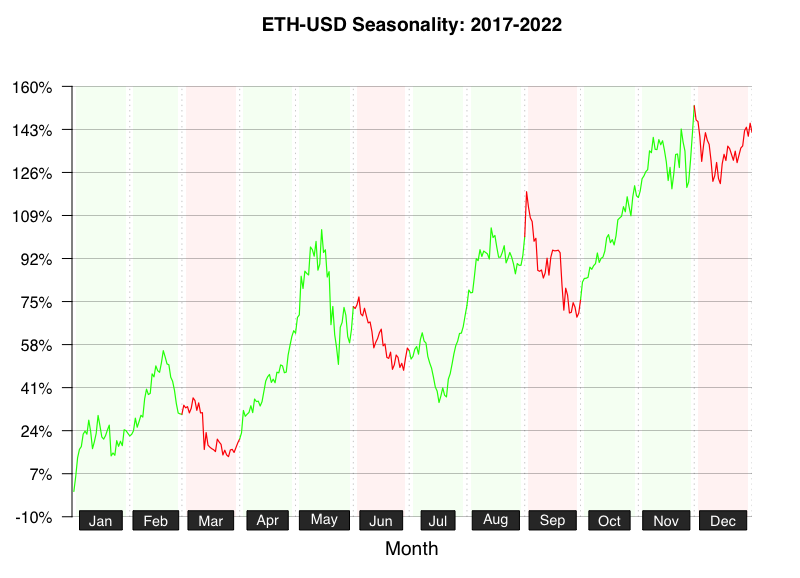
#CryptoRSI Heatmap Function provides a heatmap visualization of RSI values for a specified number of cryptocurrencies.

CryptoRSIheatmap(coin_num = 200, useRank = 1000, n = 21, useRankPlot = TRUE, OutputData = FALSE)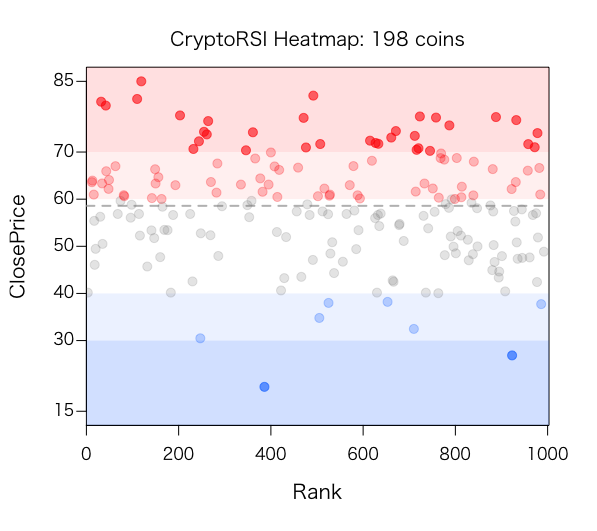
Copyright (c) 2021 Satoshi Kume
Released under the Artistic License 2.0.
These binaries (installable software) and packages are in development.
They may not be fully stable and should be used with caution. We make no claims about them.
Health stats visible at Monitor.