The hardware and bandwidth for this mirror is donated by dogado GmbH, the Webhosting and Full Service-Cloud Provider. Check out our Wordpress Tutorial.
If you wish to report a bug, or if you are interested in having us mirror your free-software or open-source project, please feel free to contact us at mirror[@]dogado.de.
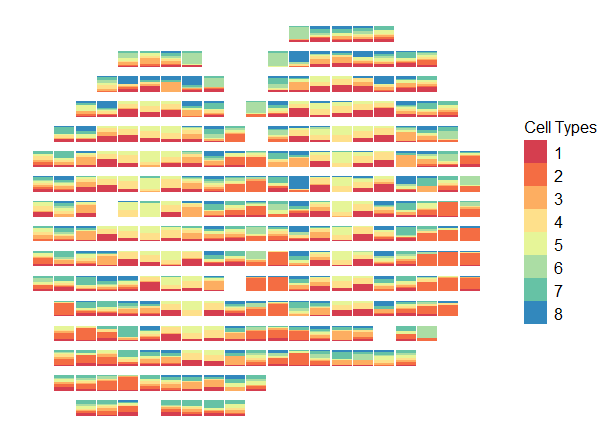
scatterbar is an open-source R package for displaying
proportional data across spatially resolved contexts. This is the
scatterbar R documentation website. Questions, suggestions,
or problems should be submitted as GitHub
issues.
![]()
By combining the concepts of scatter plots and stacked bar charts,
scatterbar allows users to visualize variations in
proportional data data and compare across different spatial
locations.
To install scatterbarfrom GitHub, we recommend using
remotes:
require(remotes)
remotes::install_github('JEFworks-Lab/scatterbar')Our preprint describing scatterbar is available on
bioRxiv:
These binaries (installable software) and packages are in development.
They may not be fully stable and should be used with caution. We make no claims about them.
Health stats visible at Monitor.