The hardware and bandwidth for this mirror is donated by dogado GmbH, the Webhosting and Full Service-Cloud Provider. Check out our Wordpress Tutorial.
If you wish to report a bug, or if you are interested in having us mirror your free-software or open-source project, please feel free to contact us at mirror[@]dogado.de.
![]()
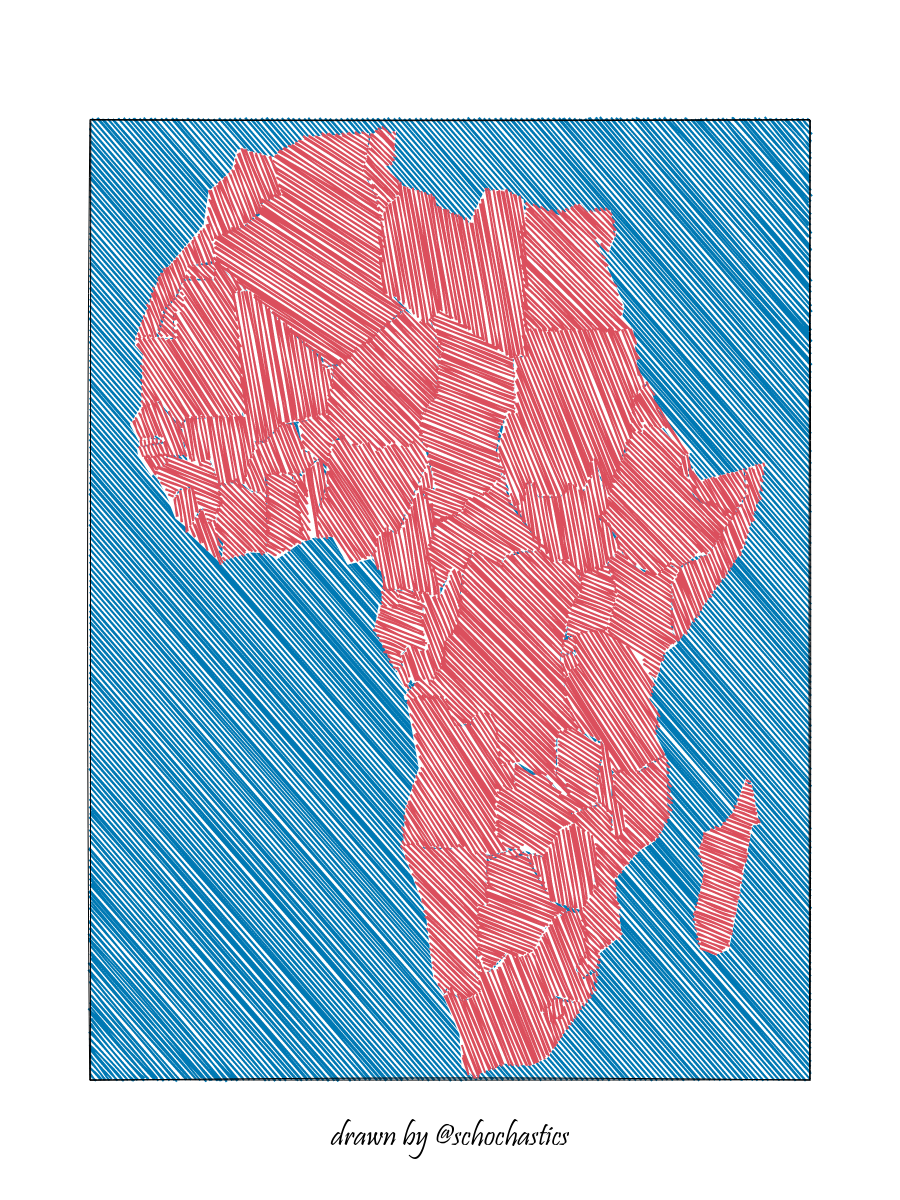
Using the java script library rough.js to draw sketchy,
hand-drawn-like maps
(Checkout ggrough for
turning general ggplot objects into sketchy drawings and roughnet for
networks)

You can install the developers version of roughsf with:
# install.packages("remotes")
remotes::install_github("schochastics/roughsf")roughsf() takes a list of sf objects as input. The
layers are drawn in order as they appear in the list. MULTI* geometries
are not supported and should be casted beforehand. Aesthetics need to be
specified explicitly as columns in the sf objects.
The following attributes are supported for POLYGONS:
The following attributes are supported for LINESTRINGS:
The following attributes are supported for POINTS:
Default values are used if one of the attributes is not found.
Values need to be specified explicitly and cannot be inferred from other columns (This needs to be done in a preparatory step)
library(sf)
ger <- rnaturalearth::ne_countries(scale = "medium", country = "Germany", returnclass = "sf")
ger <- st_cast(ger, "POLYGON")
ger$fill <- "#CD2626"
ger$stroke <- 2
ger$fillweight <- 0.5
# MULTIPOLYGON (and also MULTILINESTRING) are not supported
ger <- st_cast(ger, "POLYGON")
cities <- data.frame(name = c("Berlin", "Munich", "Hamburg", "Cologne"))
cities$geometry <- st_sfc(
st_point(c(13.4, 52.5200)), st_point(c(11.582, 48.1351)),
st_point(c(9.9937, 53.5511)), st_point(c(6.9603, 50.9375))
)
cities <- st_sf(cities)
st_crs(cities) <- "+proj=longlat +datum=WGS84 +no_defs +ellps=WGS84 +towgs84=0,0,0"
cities$size <- 15
cities$color <- "#000000"
cities$label <- cities$name
cities$label_pos <- "e"
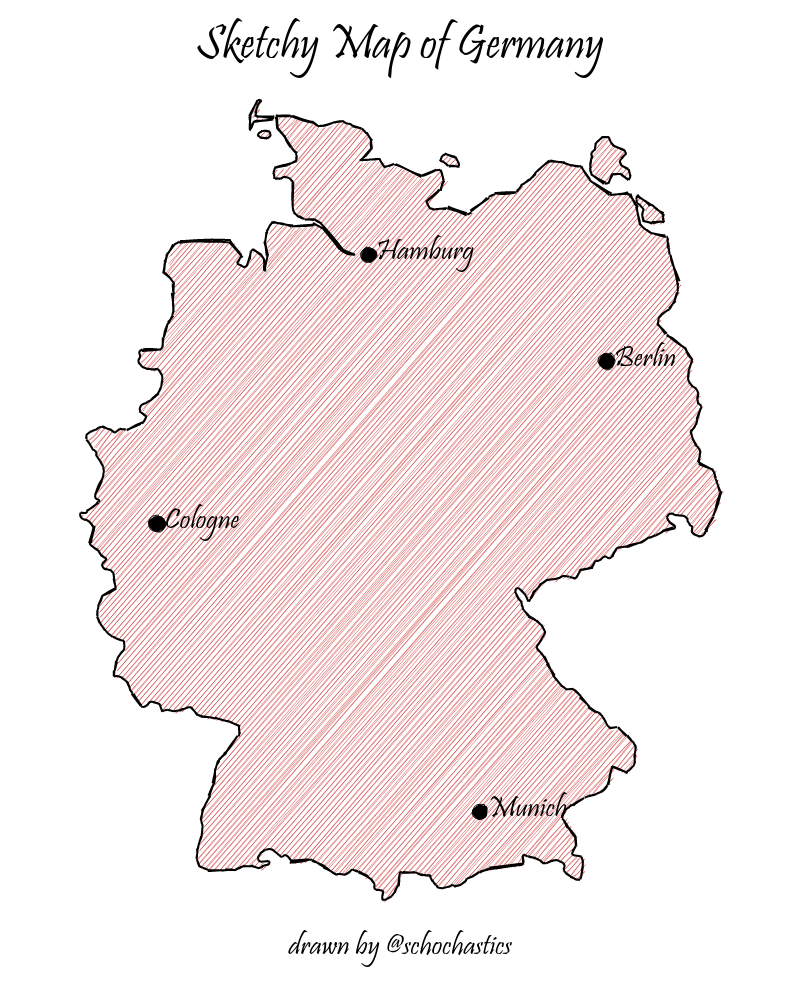
roughsf::roughsf(list(ger, cities),
title = "Sketchy Map of Germany", caption = "drawn by @schochastics",
title_font = "48px Pristina", font = "30px Pristina", caption_font = "30px Pristina",
roughness = 1, bowing = 1, simplification = 1,
width = 800, height = 1000,
)
Plots can be saved as png with the save_roughsf()
function.
These binaries (installable software) and packages are in development.
They may not be fully stable and should be used with caution. We make no claims about them.
Health stats visible at Monitor.