The hardware and bandwidth for this mirror is donated by dogado GmbH, the Webhosting and Full Service-Cloud Provider. Check out our Wordpress Tutorial.
If you wish to report a bug, or if you are interested in having us mirror your free-software or open-source project, please feel free to contact us at mirror[@]dogado.de.
![]()
![]()
![]()
rict provides clean, formatted gt tables to accompany
redistricting maps. It is designed to complement redist and redistmetrics,
but works with any electoral or demographic data.
You can install the development version of rict from GitHub with:
pak::pak('christopherkenny/rict')rict provides a family of rict_*()
functions, each producing a formatted table for a specific redistricting
quantity:
| Function | Description |
|---|---|
rict() |
District-level summary from a redist_map or
redist_plans |
rict_demographics() |
Population and voting-age population by race/ethnicity |
rict_elections() |
Democratic vote shares across electoral contests |
rict_compactness() |
Common compactness scores (Polsby-Popper, Reock, etc.) |
rict_population() |
Population and deviation from the ideal district size |
rict_splits() |
Number of administrative units split by the plan |
rict_contiguity() |
Number of contiguous pieces per district |
Additional helpers embed visuals directly inside a gt
table:
| Function | Description |
|---|---|
gt_plot_sf() |
Embed district map thumbnails |
gt_plot_compactness() |
Embed compactness geometry plots |
rict_demographics() summarizes total population and
voting-age population by race/ethnicity across districts.
library(rict)
rict_demographics(map = wv, plan = wv$cd_2020)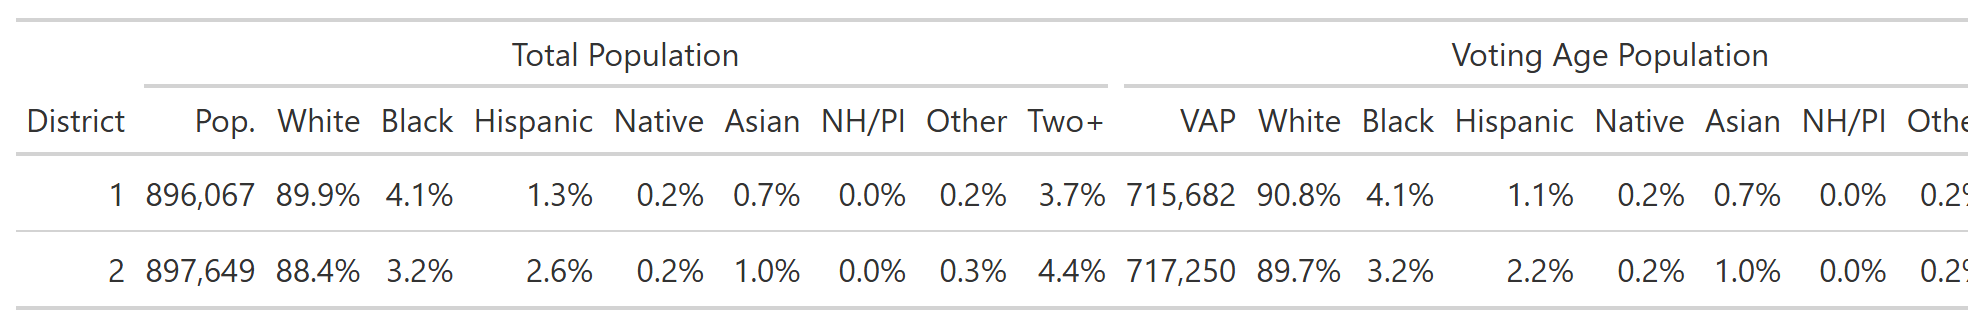
rict_compactness() tabulates common geometric
compactness scores for each district.
rict_compactness(map = wv, plan = wv$cd_2020)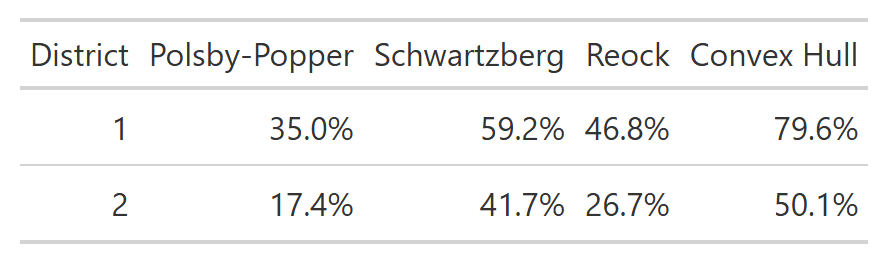
rict_elections() shows Democratic vote shares for each
electoral contest, along with normal partisan averages.
rict_elections(map = wv, plan = wv$cd_2020)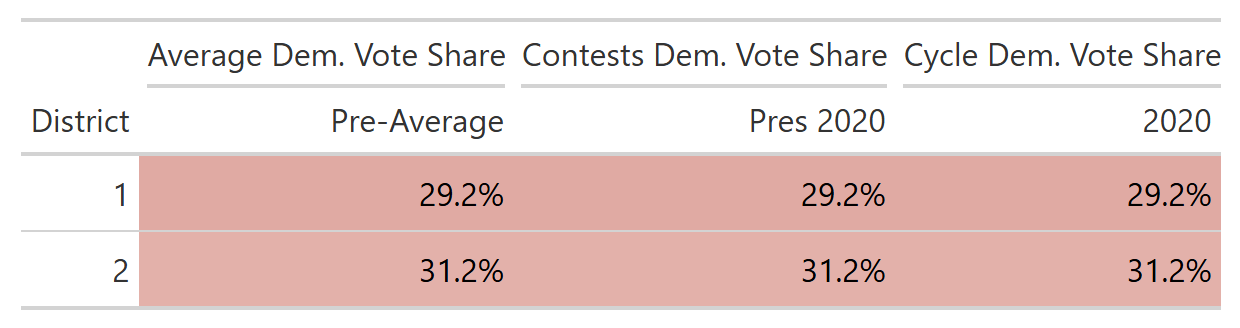
For a redist_plans object, rict() formats a
single draw as a table.
data(wv_plans)
rict(wv_plans, 'cd_2020')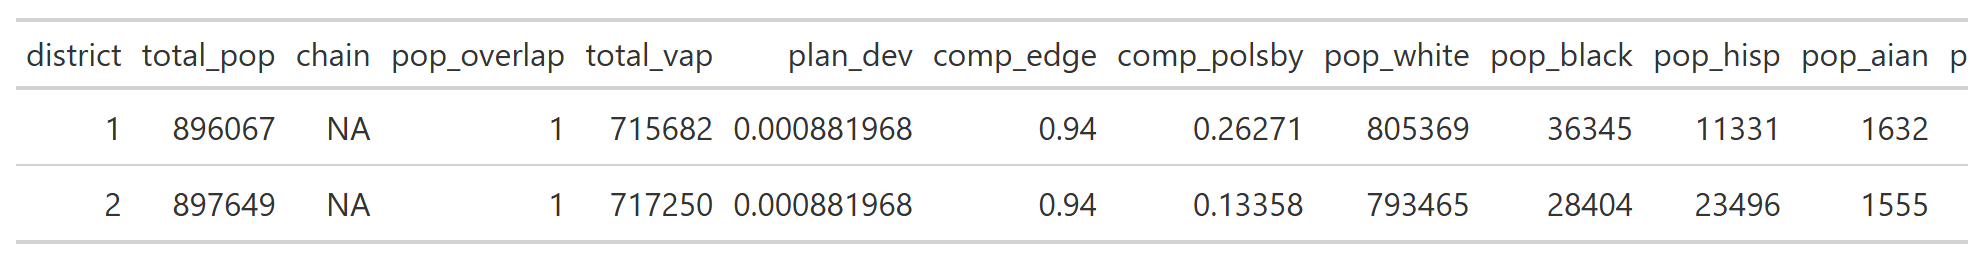
These binaries (installable software) and packages are in development.
They may not be fully stable and should be used with caution. We make no claims about them.
Health stats visible at Monitor.