
The hardware and bandwidth for this mirror is donated by dogado GmbH, the Webhosting and Full Service-Cloud Provider. Check out our Wordpress Tutorial.
If you wish to report a bug, or if you are interested in having us mirror your free-software or open-source project, please feel free to contact us at mirror[@]dogado.de.
An R implementation of the radar chart from the chart.js javascript library.
You can install from CRAN.
install.packages("radarchart")To install the latest version direct from GitHub you’ll need devtools installed. Assuming you have this run:
devtools::install_github("MangoTheCat/radarchart")Or if you want to hack about with the code then clone the repository, change directory into it and run
devtools::install()Note: htmlwidgets packages don’t work well with
devtools::load_all().
Once installed you can make a radar chart
library(radarchart)

labs <- c("Communicator", "Data Wangler", "Programmer",
          "Technologist",  "Modeller", "Visualizer")

scores <- list(
  "Rich" = c(9, 7, 4, 5, 3, 7),
  "Andy" = c(7, 6, 6, 2, 6, 9),
  "Aimee" = c(6, 5, 8, 4, 7, 6)
)

chartJSRadar(scores = scores, labs = labs, maxScale = 10)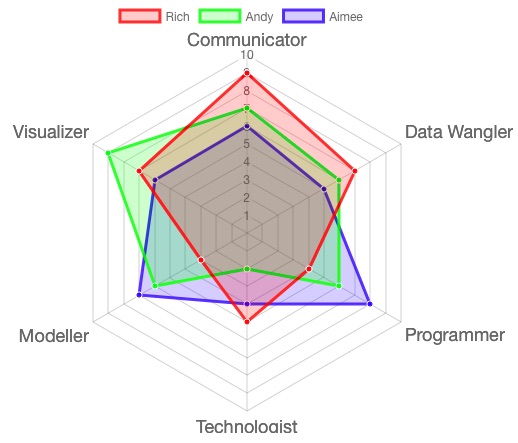
Static version. Real plots are interactive
Alternatively, you may supply a data frame and
chartJSRadar will pickup the labels from the first column
of the data. Also we’re showing an option to display data set labels in
the mouse over.
scores <- data.frame("Label"=c("Communicator", "Data Wangler", "Programmer",
                     "Technologist",  "Modeller", "Visualizer"),
                     "Rich" = c(9, 7, 4, 5, 3, 7),
                     "Andy" = c(7, 6, 6, 2, 6, 9),
                     "Aimee" = c(6, 5, 8, 4, 7, 6))

chartJSRadar(scores, maxScale = 10, showToolTipLabel=TRUE)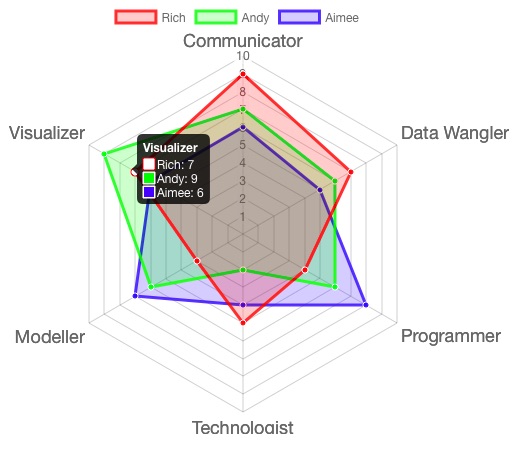
Static version. Real plots are interactive
You can now also add a title
chartJSRadar(skills, main = "Data Science Radar")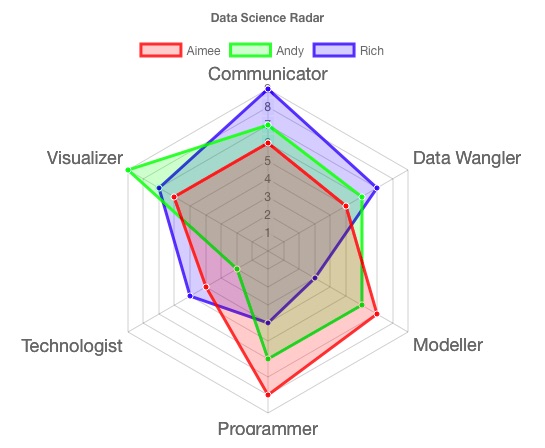
Static version. Real plots are interactive
As it’s based on htmlwidgets it’s easy to use radarchart
with Shiny. Just use the
chartJSRadarOutput("ID", width = "450", height = "300")function in your ui.R and call chartJSRadar
as normal in your server.R. A minimal example can be found
in inst/shiny-examples/basic.
You can run this with the runExampleApp function
runExampleApp("basic")An "options" app is available to help construct more
customised radar charts.
MIT © Mango Solutions, Nick Downie
These binaries (installable software) and packages are in development.
They may not be fully stable and should be used with caution. We make no claims about them.
Health stats visible at Monitor.