The hardware and bandwidth for this mirror is donated by dogado GmbH, the Webhosting and Full Service-Cloud Provider. Check out our Wordpress Tutorial.
If you wish to report a bug, or if you are interested in having us mirror your free-software or open-source project, please feel free to contact us at mirror[@]dogado.de.
promr is a PromQL
query client for the Prometheus
time-series database.
To install the development version using devtools:
devtools::install_github("domodwyer/promr")library(promr)
# Define your PromQL query
q <- "sum by (handler, result) (rate(dml_handler_write_duration_seconds_count{}[1m]))"
# And execute the query within the specified time range
df <- query_range(
q,
"2022-08-19T00:00:00Z",
"2022-08-20T00:00:00Z"
)Timestamps can be provided as rfc3339 strings, numerical
unix timestamps, or POSIXct objects. Optionally
timeout, and step parameters can be
provided.
The output df contains all the returned series, with the
measurements nested within. For this query, there are 10 series:
print(df)
## # A tibble: 10 × 3
##    handler              result  values
##    <chr>                <chr>   <list>
##  1 parallel_write       error   <tibble [8,641 × 2]>
##  2 parallel_write       success <tibble [8,641 × 2]>
##  3 partitioner          error   <tibble [8,641 × 2]>
##  4 partitioner          success <tibble [8,641 × 2]>
##  5 request              error   <tibble [8,641 × 2]>
##  6 request              success <tibble [8,641 × 2]>
##  7 schema_validator     error   <tibble [8,641 × 2]>
##  8 schema_validator     success <tibble [8,641 × 2]>
##  9 sharded_write_buffer error   <tibble [8,641 × 2]>
## 10 sharded_write_buffer success <tibble [8,641 × 2]>
The unnested data can be easily extracted using
tidyr::unnest() (part of of the tidyverse), to
produce a “long” tibble of measurements:
df |>
tidyr::unnest(values) |>
head()
## # A tibble: 6 × 4
## handler result timestamp value
## <chr> <chr> <dttm> <dbl>
## 1 parallel_write error 2022-08-19 02:00:00 0
## 2 parallel_write error 2022-08-19 02:00:10 0
## 3 parallel_write error 2022-08-19 02:00:20 0
## 4 parallel_write error 2022-08-19 02:00:30 0
## 5 parallel_write error 2022-08-19 02:00:40 0
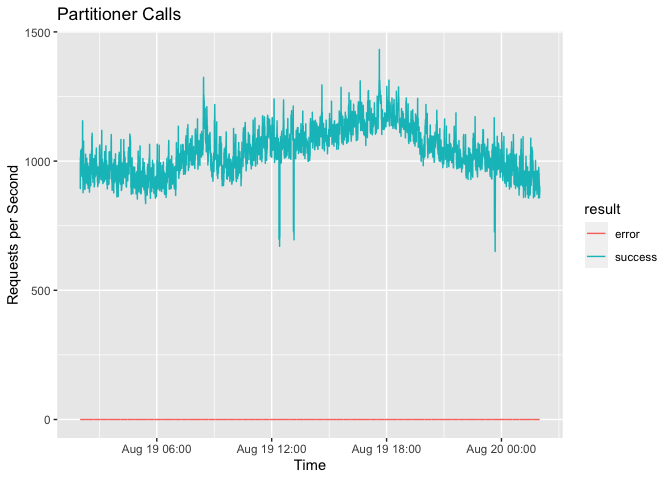
## 6 parallel_write error 2022-08-19 02:00:50 0Which makes it easy to work on, and visualise the actual data:
library(ggplot2)
library(tidyverse)

df |>
  unnest(values) |>
  filter(handler == "partitioner") |>
  ggplot(aes(x = timestamp, y = value, colour = result)) +
  geom_line() +
  labs(
    title = "Partitioner Calls",
    x = "Time",
    y = "Requests per Second"
  )
These binaries (installable software) and packages are in development.
They may not be fully stable and should be used with caution. We make no claims about them.
Health stats visible at Monitor.