
The hardware and bandwidth for this mirror is donated by dogado GmbH, the Webhosting and Full Service-Cloud Provider. Check out our Wordpress Tutorial.
If you wish to report a bug, or if you are interested in having us mirror your free-software or open-source project, please feel free to contact us at mirror[@]dogado.de.


precrec calculates and plots ROC and precision-recall
curves for binary classifiers. It is built for the case where the two
curves disagree: on an imbalanced dataset a ROC curve can look excellent
while the precision-recall curve shows the classifier is not usable. All
the main calculations are implemented in C++ through Rcpp.
library(precrec)

# Load a test dataset
data(P10N10)

# Calculate ROC and Precision-Recall curves
sscurves <- evalmod(scores = P10N10$scores, labels = P10N10$labels)
# The ggplot2 package is required
library(ggplot2)
# Show ROC and Precision-Recall plots
autoplot(sscurves)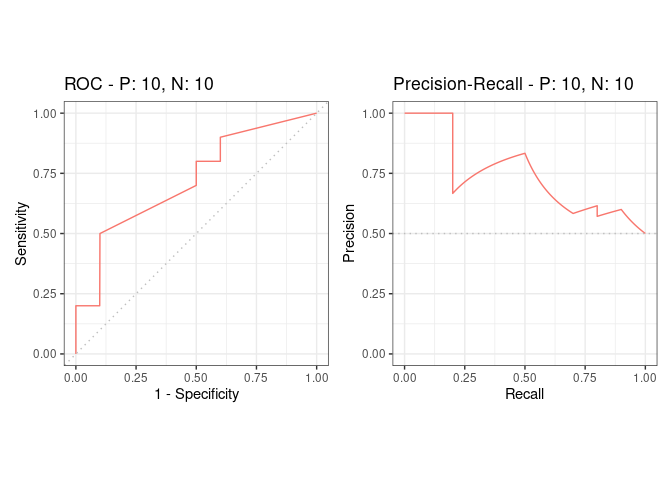
auc(sscurves) gives the areas, and
as.data.frame(sscurves) gives the curve points.
Everything is on the package website, in short pages:
vignette("introduction", package = "precrec").help(package = "precrec").Accurate curves. Non-linear interpolation, elongation to the y axis where the first point is undefined, and score-wise thresholds instead of fixed bins. Joining raw precision-recall points with straight lines – what most tools do – overestimates the area.
Fast. Curves over a large dataset take seconds.
mode = "aucroc" computes the ROC area from the U statistic
without building the curve at all.
Many metrics. Fourteen per-cutoff metrics by default and seventeen more on request, plus AUC, partial AUC, the precision-recall break-even point, and the probability-based Brier score, RMSE and log loss. See the metrics overview.
Several models and several test sets. Averaged curves with confidence bands, cross-validation folds, and confidence intervals of the AUC.
More than two classes. One-vs-rest decomposition, with per-class and macro-averaged areas.
Partial curves. Partial AUCs for any x or y range, standardized so ranges of different widths can be compared.
Install the release version from CRAN:
install.packages("precrec")Or the development version from GitHub, which needs a working compiler (Rtools on Windows, Xcode on macOS, the usual build tools on Linux):
# install.packages("devtools")
devtools::install_github("evalclass/precrec")| Function | Description |
|---|---|
evalmod |
Main function to calculate evaluation metrics |
mmdata |
Reformat input data for performance evaluation calculation |
join_scores |
Join scores of multiple models into a list |
join_labels |
Join observed labels of multiple test datasets into a list |
create_sim_samples |
Create random samples for simulations |
format_nfold |
Create n-fold cross validation dataset from data frame |
prob_metrics |
Calculate the Brier score, the RMSE and the log loss |
prob_metrics_ci |
Calculate CIs of the Brier score, the RMSE and the log loss |
metric_curve |
Draw one evaluation metric against another |
metric_table |
Get every evaluation metric at every cutoff |
best_cutoff |
Pick the cutoff that optimizes one evaluation metric |
prbe |
Find the precision-recall break-even point |
average_precision |
Calculate the step estimator of the PRC area |
classification_report |
Report precision, recall and F-score per class at a threshold |
auc_boot |
Bootstrap the AUC of a single test set |
auc_delong |
Analytic standard error of the ROC AUC (DeLong) |
auc_diff |
Compare the AUCs of two models on the same resamples |
Ten S3 generics work on the objects evalmod and
metric_curve return.
| S3 generic | Package | Description |
|---|---|---|
print |
base | Print the calculation results and the summary of the test data |
as.data.frame |
base | Convert a precrec object to a data frame |
as.data.table |
data.table | Convert a precrec object to a data.table |
plot |
graphics | Plot performance evaluation metrics |
autoplot |
ggplot2 | Plot performance evaluation metrics with ggplot2 |
fortify |
ggplot2 | Prepare a data frame for ggplot2 |
auc |
precrec | Make a data frame with AUC scores |
part |
precrec | Calculate partial curves and partial AUC scores |
pauc |
precrec | Make a data frame with pAUC scores |
auc_ci |
precrec | Calculate confidence intervals of AUC scores |
Precrec: fast and accurate precision-recall and ROC curve calculations in R
Takaya Saito; Marc Rehmsmeier
Bioinformatics 2017; 33 (1): 145-147.
doi: 10.1093/bioinformatics/btw570
Classifier evaluation with imbalanced datasets - our web site that contains several pages with useful tips for performance evaluation on binary classifiers.
The Precision-Recall Plot Is More Informative than the ROC Plot When Evaluating Binary Classifiers on Imbalanced Datasets - our paper that summarized potential pitfalls of ROC plots with imbalanced datasets and advantages of using precision-recall plots instead.
These binaries (installable software) and packages are in development.
They may not be fully stable and should be used with caution. We make no claims about them.
Health stats visible at Monitor.