The hardware and bandwidth for this mirror is donated by dogado GmbH, the Webhosting and Full Service-Cloud Provider. Check out our Wordpress Tutorial.
If you wish to report a bug, or if you are interested in having us mirror your free-software or open-source project, please feel free to contact us at mirror[@]dogado.de.
![]()
Personalize drug regimens using individual pharmacokinetic (PK) and
pharmacokinetic-pharmacodynamic (PK-PD) profiles. By combining
therapeutic drug monitoring (TDM) data with a population model,
posologyr offers accurate posterior estimates and helps
compute optimal individualized dosing regimens.
Key dosage optimization functions in posologyr
include:
poso_dose_conc() estimates the optimal dose to achieve
a target concentration at any given timeposo_dose_auc() estimates the dose needed to reach a
target area under the concentration-time curve (AUC)poso_time_cmin() estimates the time required to reach a
target trough concentration (Cmin)poso_inter_cmin() estimates the optimal dosing interval
to consistently achieve a target CminIndividual PK profiles can be estimated with or without TDM data:
poso_estim_map() computes Maximum A Posteriori Bayesian
Estimates (MAP-BE) of individual PK parameters using TDM resultsposo_simu_pop() samples from the the prior
distributions of PK parametersposologyr leverages the simulation capabilities of the
rxode2 package.
You can install the released version of posologyr from
CRAN with:
install.packages("posologyr")You can install the development version of posologyr
from GitHub with:
# install.packages("remotes")
remotes::install_github("levenc/posologyr")To determine the optimal dose of gentamicin for a patient with
posologyr, you will need:
rxode2 mini-languageIn this example, a gentamicin PK from the literature doi:10.1016/j.ijantimicag.2003.07.010
mod_gentamicin_Xuan2003 <- function() {
  ini({
    THETA_Cl  = 0.047
    THETA_V   = 0.28
    THETA_k12 = 0.092
    THETA_k21 = 0.071
    ETA_Cl  ~ 0.084
    ETA_V   ~ 0.003
    ETA_k12 ~ 0.398
    ETA_k21 ~ 0.342
    add_sd  <- 0.230
    prop_sd <- 0.237
  })
  model({
    TVl   = THETA_Cl*ClCr
    TVV   = THETA_V*WT
    TVk12 = THETA_k12
    TVk21 = THETA_k21

    Cl    = TVl*exp(ETA_Cl)
    V     = TVV*exp(ETA_V)
    k12   = TVk12*exp(ETA_k12)
    k21   = TVk21 *exp(ETA_k21)

    ke    = Cl/V
    Cp    = centr/V

    d/dt(centr)  = - ke*centr - k12*centr + k21*periph
    d/dt(periph) =            + k12*centr - k21*periph

    Cp ~ add(add_sd) + prop(prop_sd) + combined1()
  })
}patient_data <- data.frame(ID=1,
TIME=c(0.0,1.0,11.0),
DV=c(NA,9,2),
AMT=c(180,0,0),
DUR=c(0.5,NA,NA),
EVID=c(1,0,0),
ClCr=38,
WT=63)
patient_data
#> ID TIME DV AMT DUR EVID ClCr WT
#> 1 1 0 NA 180 0.5 1 38 63
#> 2 1 1 9 0 NA 0 38 63
#> 3 1 11 2 0 NA 0 38 63With these two elements, you can estimate and plot and the individual concentrations over time.
library("posologyr")patient_map <- poso_estim_map(patient_data,mod_gentamicin_Xuan2003)
plot(patient_map$model,Cc)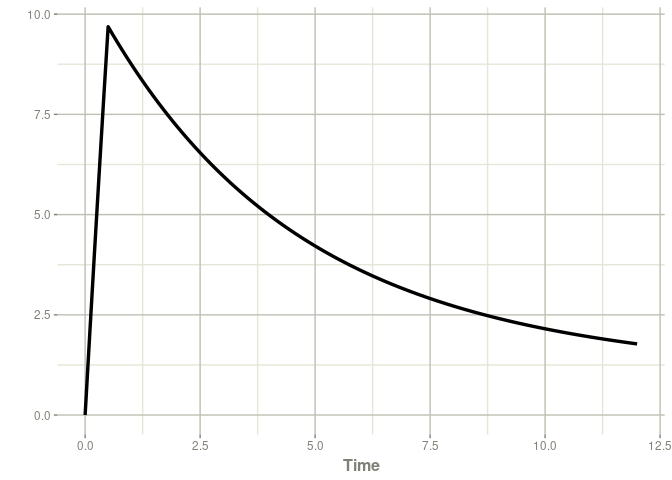
We will optimize the gentamicin dosage for this patient to meet two criteria:
The time required to reach a residual concentration of 0.5 mg/L can be estimated as follows:
poso_time_cmin(patient_data,mod_gentamicin_Xuan2003,tdm=TRUE,
               target_cmin = 0.5)
#> $time
#> [1] 44.9
#>
#> $type_of_estimate
#> [1] "point estimate"
#>
#> $cmin_estimate
#> [1] 0.4991313
#>
#> $indiv_param
#>   THETA_Cl THETA_V THETA_k12 THETA_k21 add_sd prop_sd     ETA_Cl       ETA_V
#> 3    0.047    0.28     0.092     0.071   0.23   0.237 0.03701064 0.001447308
#>      ETA_k12     ETA_k21 ClCr WT
#> 3 0.08904703 -0.04838898   38 63
The dose required to achieve our target concentration can then be determined for an infusion at H48.
poso_dose_conc(patient_data,mod_gentamicin_Xuan2003,tdm=TRUE,
               target_conc = 12,duration=0.5,time_dose = 48,time_c = 49)
#> $dose
#> [1] 237.5902
#>
#> $type_of_estimate
#> [1] "point estimate"
#>
#> $conc_estimate
#> [1] 12
#>
#> $indiv_param
#>   THETA_Cl THETA_V THETA_k12 THETA_k21 add_sd prop_sd     ETA_Cl       ETA_V
#> 3    0.047    0.28     0.092     0.071   0.23   0.237 0.03701052 0.001447305
#>      ETA_k12     ETA_k21 ClCr WT
#> 3 0.08904752 -0.04838936   38 63
In conclusion a dose of 240 mg 48 h after the first injection would be appropriate to meet our 2 criteria.
More examples can be found at: https://levenc.github.io/posologyr/
posologyr showed comparable performance to NONMEM MAP
estimation with option MAXEVAL=0:
These binaries (installable software) and packages are in development.
They may not be fully stable and should be used with caution. We make no claims about them.
Health stats visible at Monitor.