The hardware and bandwidth for this mirror is donated by dogado GmbH, the Webhosting and Full Service-Cloud Provider. Check out our Wordpress Tutorial.
If you wish to report a bug, or if you are interested in having us mirror your free-software or open-source project, please feel free to contact us at mirror[@]dogado.de.
mcStats
![]()
================ This package is used to visualize distributions in relation to traditional hypothesis tests. We have found that students are capable of interpreting p-values, but often struggle with understanding how they relate to the underlying distribution. The stats package performs statistical tests while we visualize the results.
showProp.Test(3, 10)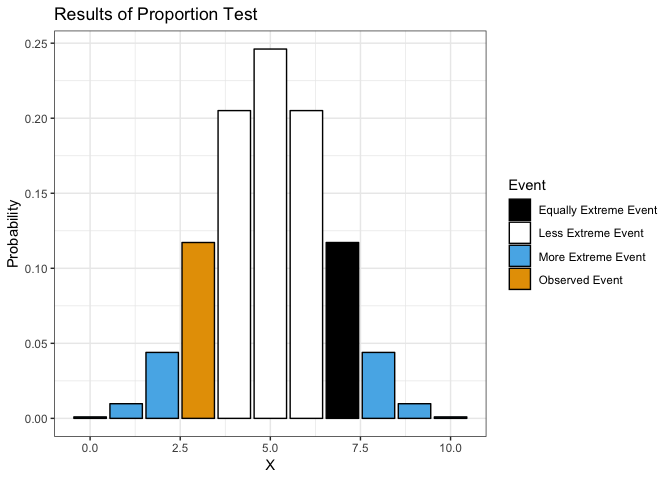
##
##  Exact binomial test
##
## data:  x and n
## number of successes = 3, number of trials = 10, p-value = 0.3438
## alternative hypothesis: true probability of success is not equal to 0.5
## 95 percent confidence interval:
##  0.06673951 0.65245285
## sample estimates:
## probability of success
## 0.3Test with null hypothesis mean = 0.
x <- rnorm(10)
showT.Test(x)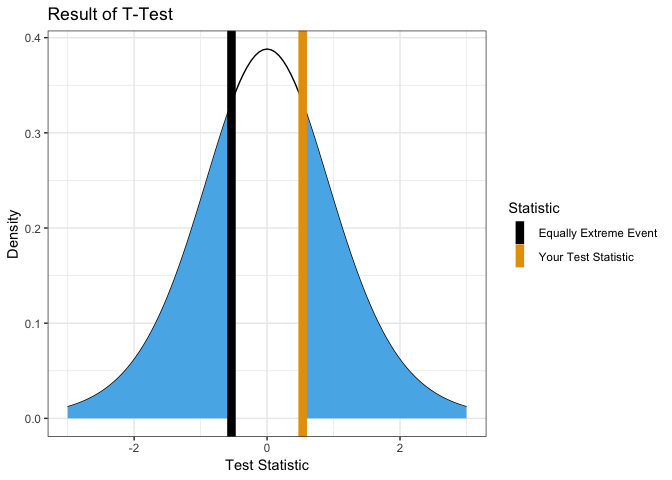
##
##  One Sample t-test
##
## data:  group1
## t = -0.97931, df = 9, p-value = 0.353
## alternative hypothesis: true mean is not equal to 0
## 95 percent confidence interval:
##  -0.9367283  0.3707214
## sample estimates:
##  mean of x
## -0.2830035
Test with null hypothesis mean = 0.5.
showT.Test(x, mu = 0.5)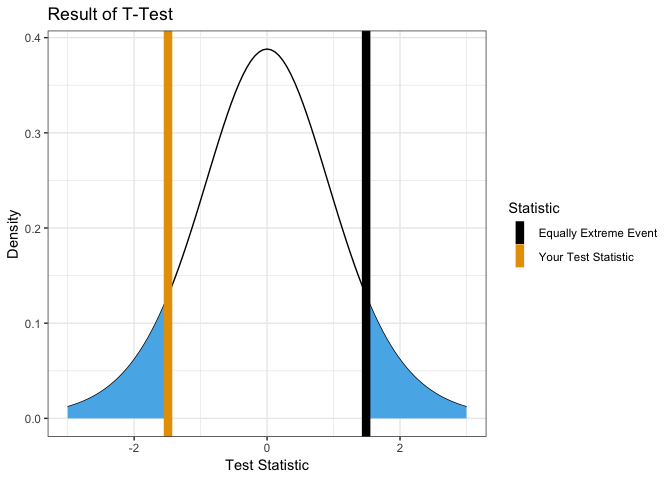
##
##  One Sample t-test
##
## data:  group1
## t = -2.7095, df = 9, p-value = 0.02402
## alternative hypothesis: true mean is not equal to 0.5
## 95 percent confidence interval:
##  -0.9367283  0.3707214
## sample estimates:
##  mean of x
## -0.2830035y <- rnorm(10, mean = 0.1)
showT.Test(x,y)x <- matrix(runif(9,5,100), ncol = 3, dimnames = list(c("Yes1", "No1", "Maybe 1"),
c("Yes2", "No2", "Maybe 2")))
mosaicplot(x)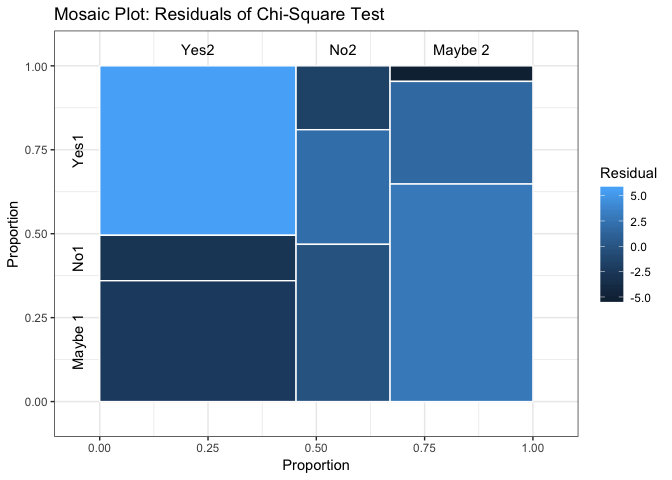
showChiSq.Test(x)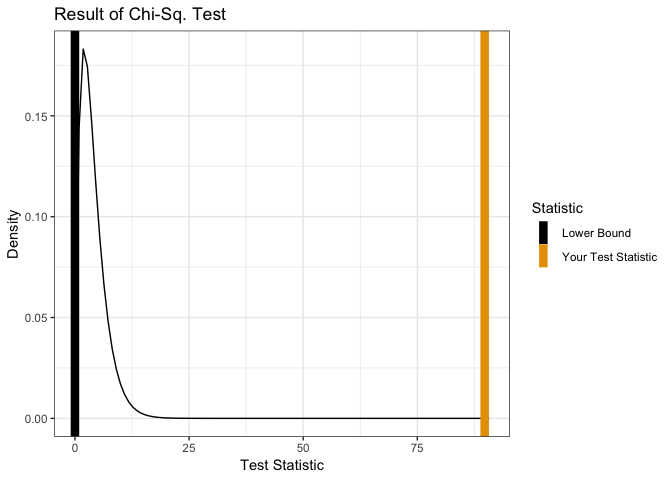
##
##  Pearson's Chi-squared test
##
## data:  x
## X-squared = 20.445, df = 4, p-value = 0.0004078Performance <-
matrix(c(794, 86, 150, 570),
nrow = 2,
dimnames = list("1st Survey" = c("Approve", "Disapprove"),
"2nd Survey" = c("Approve", "Disapprove")))
showMcNemarTest(Performance)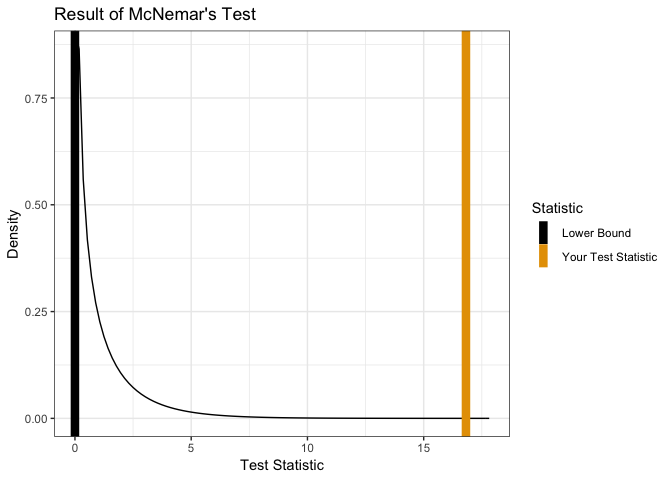
##
##  McNemar's Chi-squared test with continuity correction
##
## data:  x
## McNemar's chi-squared = 16.818, df = 1, p-value = 4.115e-05bootstrap(mean, x, 0, 100)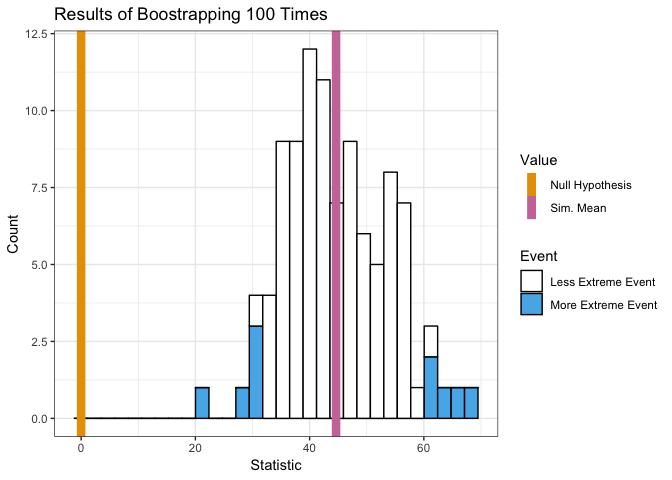
##   [1] 54.90774 51.07035 62.03353 59.45124 42.65071 53.54602 58.19805
##   [8] 49.23022 42.80682 48.37725 55.93226 43.66260 38.76233 37.54761
##  [15] 48.67384 42.42315 64.43235 68.48759 55.88688 54.98819 45.01146
##  [22] 44.32679 44.94303 52.94193 40.54650 47.56330 46.70979 42.63162
##  [29] 34.53033 64.46052 42.53795 46.94533 41.18465 36.09311 48.51360
##  [36] 50.08601 58.49279 44.25783 47.79896 45.98412 63.10048 50.72895
##  [43] 62.70815 70.40356 44.79826 44.72806 55.45402 44.30009 48.20786
##  [50] 42.41185 59.92486 43.56006 43.01403 32.92129 49.30569 36.82319
##  [57] 46.08493 51.61663 51.93606 58.78356 26.15019 69.00779 59.82237
##  [64] 49.10645 56.87518 50.13957 49.68720 33.95228 51.20886 44.01459
##  [71] 66.88024 38.29459 63.04476 45.01572 56.02155 61.85452 56.19405
##  [78] 55.77186 49.30737 43.08087 44.30009 37.41971 55.21450 41.24469
##  [85] 49.87103 68.78172 47.83253 50.72265 48.07421 52.72435 48.62027
##  [92] 40.54171 55.14868 51.01445 43.22471 50.76491 54.59131 50.19763
## [99] 55.68494 57.43471showANOVA(yield ~ N + P + K, npk)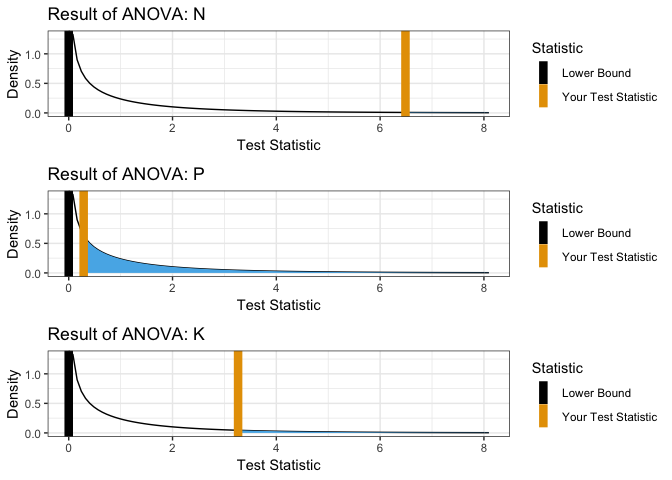
showOLS(mpg ~ cyl + disp, mtcars)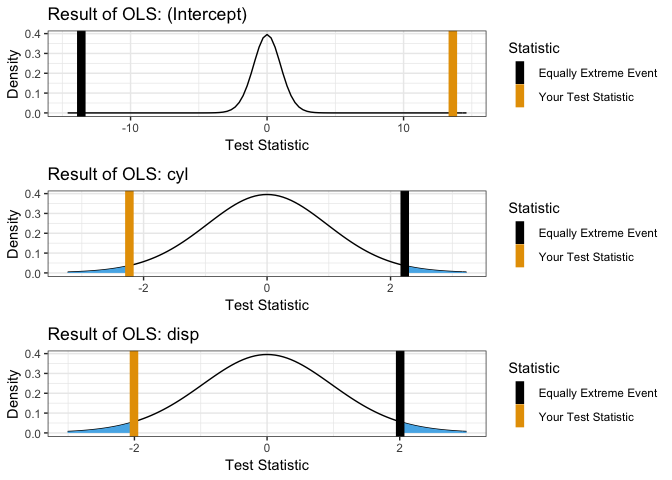
These binaries (installable software) and packages are in development.
They may not be fully stable and should be used with caution. We make no claims about them.
Health stats visible at Monitor.