The hardware and bandwidth for this mirror is donated by dogado GmbH, the Webhosting and Full Service-Cloud Provider. Check out our Wordpress Tutorial.
If you wish to report a bug, or if you are interested in having us mirror your free-software or open-source project, please feel free to contact us at mirror[@]dogado.de.
The goal of mapSenegal is to provides access to
administrative boundaries of Senegal at several levels (regions,
departements, arrondissements and communes). These boundaries are based
on GDAM. The package also
gives access to roads, localities, universities and health facilities
locations.
You can install the development version of mapSenegal
with:
# install.packages("remotes")
remotes::install_github("rCarto/mapSenegal")This is a basic example which shows you how to use the package.
library(mapSenegal)
#> Loading required package: sf
#> Linking to GEOS 3.13.1, GDAL 3.10.3, PROJ 9.6.0; sf_use_s2() is TRUE
library(mapsf)
reg <- sn_regions()
ardt <- sn_arrondissements()
mf_map(ardt)
mf_map(reg, col = NA, lwd = 3, add = TRUE)
mf_scale(pos = "bottomleft")
mf_title("Regions & Arrondissements of Senegal")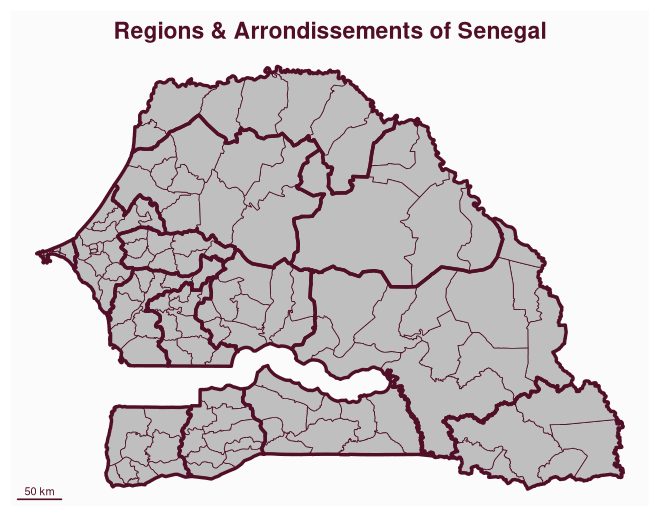
The following maps shows the different layers provided by the package.
# import
pays <- sn_country()
zone <- sn_neighbors()
reg <- sn_regions()
dep <- sn_departments()
ardt <- sn_arrondissements()
com <- sn_communes()
loc <- sn_localities()
hf <- sn_health_facilities()
univ <- sn_universities()
roads <- sn_roads()

mf_map(pays, col = NA, border = NA, expandBB = c(0, 0, .05, 0))
mf_map(zone, col = "lightgrey", add = TRUE)
mf_shadow(pays, add = TRUE)
mf_graticule(pays, add = T)
mf_map(com, lwd = .5, add = TRUE, border = 0)
mf_map(dep, lwd = 1.5, add = TRUE, col = NA, border = 0)
mf_map(reg, col = NA, lwd = 2, add = TRUE)
mf_label(reg, "NAME", halo = TRUE, cex = .9, pos = 1)
mf_scale(pos = "bottomleft")
mf_title("Administrative Units")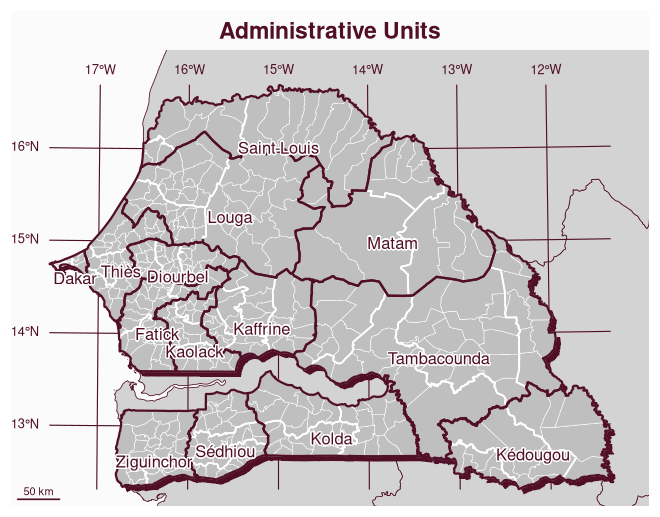
mf_map(pays, col = NA, border = NA)
mf_map(zone, col = "lightgrey", add = TRUE)
mf_map(pays, lwd = 2, add = TRUE)
mf_map(subset(roads, TYPE %in% 4:5), col = "darkblue", lwd = .5, add = TRUE)
mf_map(subset(roads, TYPE %in% 1:3), col = "darkblue", lwd = 4, add = TRUE)
mf_map(subset(roads, TYPE %in% 1:3), col = "white", lwd = .5, add = TRUE)
mf_arrow()
mf_scale(pos = "bottomleft")
mf_title("Road Network")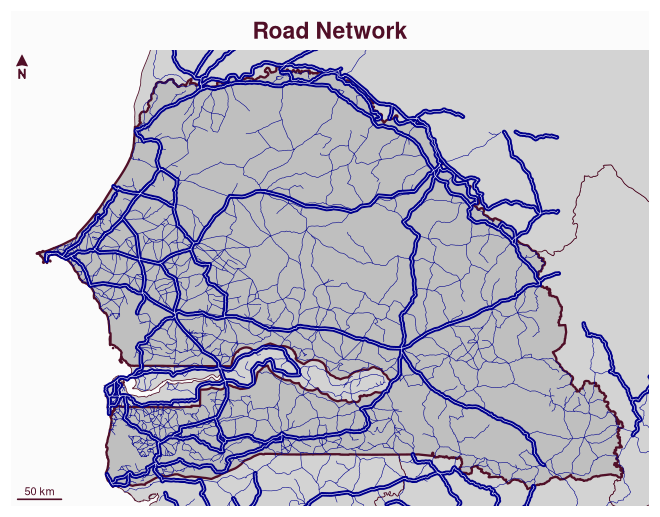
mf_map(pays, col = NA, border = NA)
mf_map(zone, col = "lightgrey", add = TRUE)
mf_shadow(pays, add = TRUE)
mf_map(pays, lwd = 2, add = TRUE)
mf_map(dep, col = NA, lwd = 1, add = TRUE)
mf_map(loc, pch = ".", col = "#940000", add = TRUE)
mf_arrow()
mf_scale(pos = "bottomleft")
mf_title(paste0(nrow(loc), " Localities"))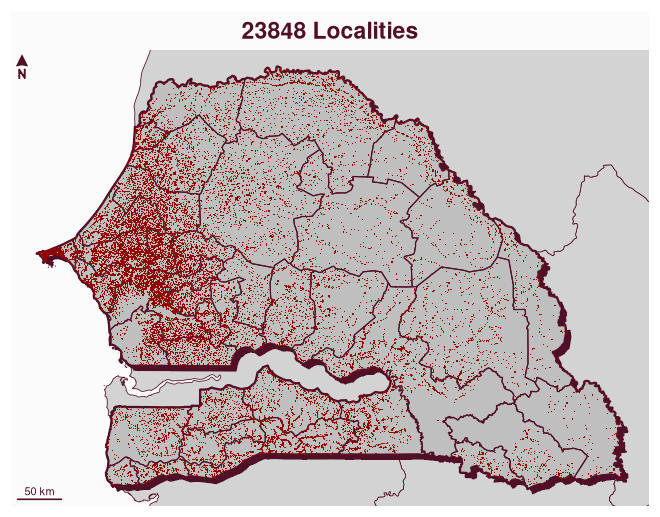
mf_map(pays, col = NA, border = NA)
mf_map(zone, col = "lightgrey", add = TRUE)
mf_shadow(pays, add = TRUE)
mf_map(pays, add = TRUE)
mf_map(reg, col = NA, lwd = 1, add = TRUE)
mf_map(univ, "NB_STUDENTS", "prop", leg_val_big = " ")
mf_annotation(
  x = c(239471, 1655820),
  txt = "Université Numérique Cheikh Hamidou Lane", halo = T
)
mf_annotation(c(239471, 1595149),
  txt = "Université Cheick Anta Diop", halo = T, pos = "bottomright"
)
mf_arrow()
mf_scale(pos = "bottomleft")
mf_title("Universities")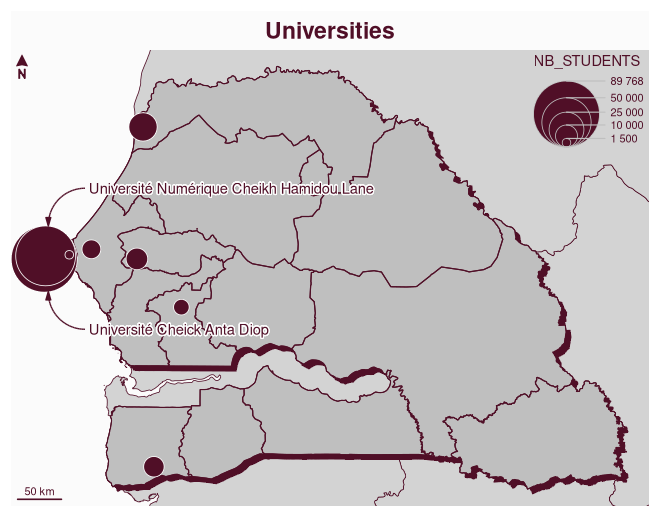
mf_map(pays, col = NA, border = NA, expandBB = c(0, 0, 0, .1))
mf_map(zone, col = "lightgrey", add = TRUE)
mf_shadow(pays, add = TRUE)
mf_map(pays, add = TRUE)
mf_map(hf,
  var = "TYPE", type = "symb", cex = .75,
  pal = "Dark 3", add = TRUE, leg_title = "",
  leg_pos = "topright", leg_frame = TRUE
)
mf_arrow()
mf_scale(pos = "bottomleft")
mf_title("Health facilities")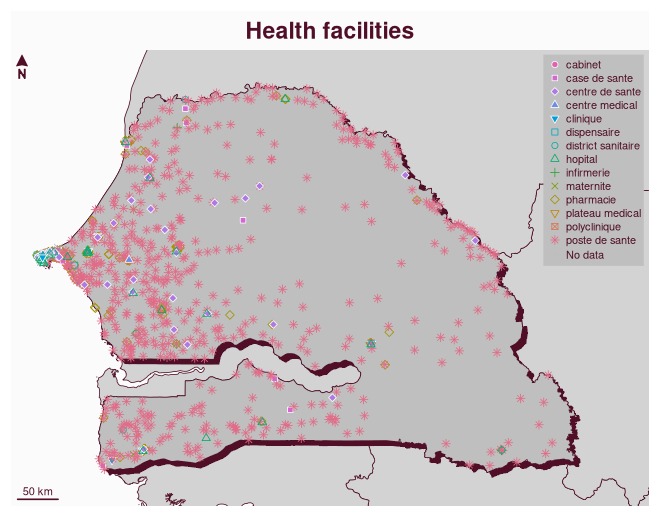
These binaries (installable software) and packages are in development.
They may not be fully stable and should be used with caution. We make no claims about them.
Health stats visible at Monitor.