The hardware and bandwidth for this mirror is donated by dogado GmbH, the Webhosting and Full Service-Cloud Provider. Check out our Wordpress Tutorial.
If you wish to report a bug, or if you are interested in having us mirror your free-software or open-source project, please feel free to contact us at mirror[@]dogado.de.
![]()
![]()
linemap() displays a map made of lines using a raster or
gridded data.
You can install linemap from CRAN with:
install.packages("linemap")The package contains one function: linemap().
library(linemap)
r <- terra::rast(system.file("tif/elevation.tif", package = "linemap"))
opar <- par(mar = c(0,0,0,0), bg = "grey10")
linemap(r)
par(opar)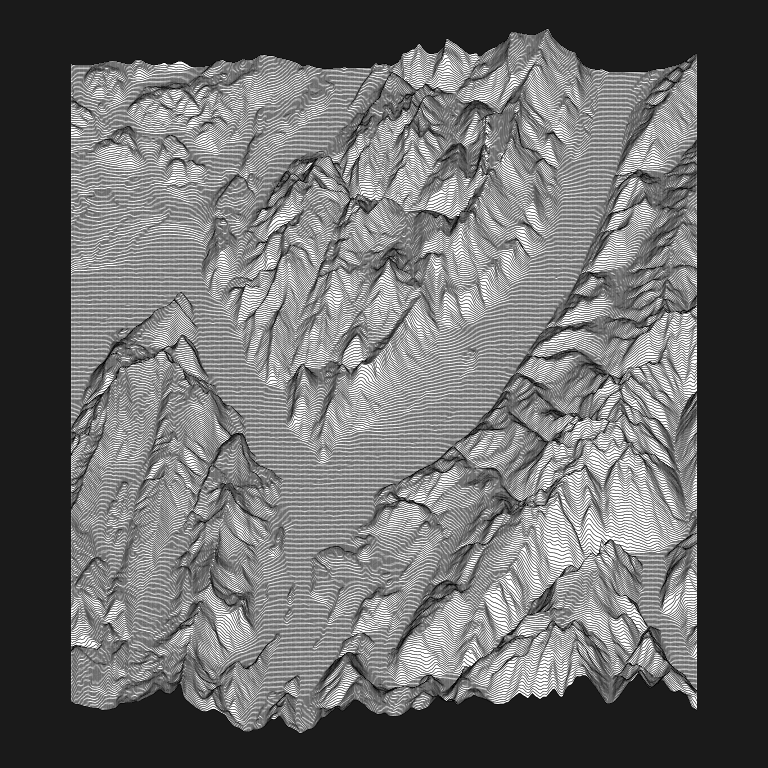
Unknown
Pleasures (Joy Division)
Population
Lines: How and Why I Created It (James Cheshire)
GeospatialLineGraphs
(Ryan Brideau)
These binaries (installable software) and packages are in development.
They may not be fully stable and should be used with caution. We make no claims about them.
Health stats visible at Monitor.