The hardware and bandwidth for this mirror is donated by dogado GmbH, the Webhosting and Full Service-Cloud Provider. Check out our Wordpress Tutorial.
If you wish to report a bug, or if you are interested in having us mirror your free-software or open-source project, please feel free to contact us at mirror[@]dogado.de.
![]()
![]()
![]()
The R package ‘iglu’ provides functions for outputting relevant metrics for data collected from Continuous Glucose Monitors (CGM). For reference, see “Interpretation of continuous glucose monitoring data: glycemic variability and quality of glycemic control.” Rodbard (2009). For more information on the package, see package website.
To cite:
Broll S, Urbanek J, Buchanan D, Chun E, Muschelli J, Punjabi N and Gaynanova I (2021). Interpreting blood glucose data with R package iglu. PLoS One, Vol. 16, No. 4, e0248560.
Broll S, Buchanan D, Chun E, Muschelli J, Fernandes N, Seo J, Shih J, Urbanek J, Schwenck J, Gaynanova I (2021). iglu: Interpreting Glucose Data from Continuous Glucose Monitors. R package version 3.0.0.
iglu comes with two example datasets: example_data_1_subject and example_data_5_subject. These data are collected using Dexcom G4 CGM on subjects with Type II diabetes. Each dataset follows the structure iglu’s functions are designed around. Note that the 1 subject data is a subset of the 5 subject data. See the examples below for loading and using the data.
The R package ‘iglu’ is available from CRAN, use the commands below to install the most recent Github version.
# Plain installation
devtools::install_github("irinagain/iglu") # iglu package

# For installation with vignette
devtools::install_github("irinagain/iglu", build_vignettes = TRUE)library(iglu)
data(example_data_1_subject) # Load single subject data
## Plot data
# Use plot on dataframe with time and glucose values for time series plot
plot_glu(example_data_1_subject)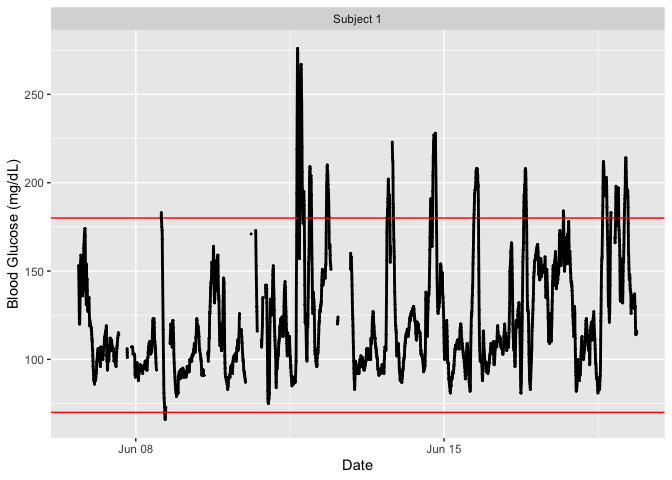
# Summary statistics and some metrics
summary_glu(example_data_1_subject)
#> # A tibble: 1 × 7
#> # Groups:   id [1]
#>   id         Min. `1st Qu.` Median  Mean `3rd Qu.`  Max.
#>   <fct>     <dbl>     <dbl>  <dbl> <dbl>     <dbl> <dbl>
#> 1 Subject 1    66        99    112  124.       143   276

in_range_percent(example_data_1_subject)
#> # A tibble: 1 × 3
#>   id        in_range_63_140 in_range_70_180
#>   <fct>               <dbl>           <dbl>
#> 1 Subject 1            73.9            91.7

above_percent(example_data_1_subject, targets = c(80,140,200,250))
#> # A tibble: 1 × 5
#>   id        above_140 above_200 above_250 above_80
#>   <fct>         <dbl>     <dbl>     <dbl>    <dbl>
#> 1 Subject 1      26.1      3.40     0.377     99.3

j_index(example_data_1_subject)
#> # A tibble: 1 × 2
#>   id        J_index
#>   <fct>       <dbl>
#> 1 Subject 1    24.6

conga(example_data_1_subject)
#> # A tibble: 1 × 2
#>   id        CONGA
#>   <fct>     <dbl>
#> 1 Subject 1  37.0

# Load multiple subject data
data(example_data_5_subject)

plot_glu(example_data_5_subject, plottype = 'lasagna', datatype = 'average')
#> Warning: Removed 5 rows containing missing values (`geom_tile()`).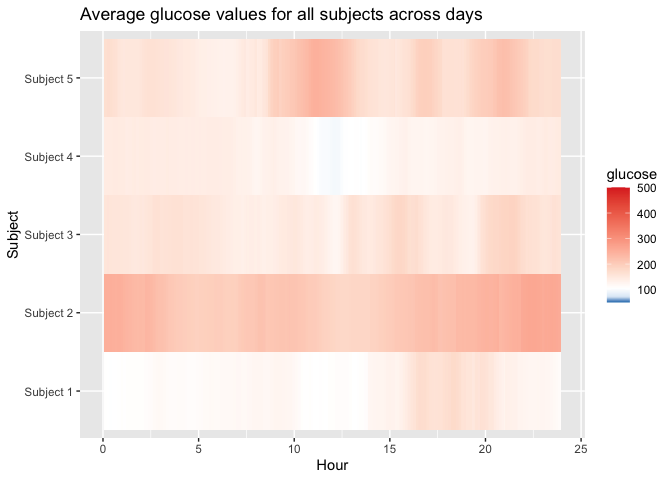
below_percent(example_data_5_subject, targets = c(80,170,260))
#> # A tibble: 5 × 4
#>   id        below_170 below_260 below_80
#>   <fct>         <dbl>     <dbl>    <dbl>
#> 1 Subject 1      89.3      99.7    0.583
#> 2 Subject 2      16.8      78.4    0
#> 3 Subject 3      72.7      95.9    0.848
#> 4 Subject 4      91.0     100      1.69
#> 5 Subject 5      54.6      90.1    1.03

mage(example_data_5_subject)
#> Gap found in data for subject id: Subject 2, that exceeds 12 hours.
#> # A tibble: 5 × 2
#> # Rowwise:
#>   id         MAGE
#>   <fct>     <dbl>
#> 1 Subject 1  87.2
#> 2 Subject 2 111.
#> 3 Subject 3 115.
#> 4 Subject 4  70.1
#> 5 Subject 5 146.
Shiny App can be accessed locally via
or globally at https://irinagain.shinyapps.io/shiny_iglu/. As new functionality gets added, local version will be slightly ahead of the global one.
These binaries (installable software) and packages are in development.
They may not be fully stable and should be used with caution. We make no claims about them.
Health stats visible at Monitor.