The hardware and bandwidth for this mirror is donated by dogado GmbH, the Webhosting and Full Service-Cloud Provider. Check out our Wordpress Tutorial.
If you wish to report a bug, or if you are interested in having us mirror your free-software or open-source project, please feel free to contact us at mirror[@]dogado.de.
![]()
![]()
![]()
Build modern web applications in R — without writing JavaScript.
htmx handles client-side interactions
via HTML attributes. plumber2
handles R endpoints server-side. {htmxr} bridges the two
with R helpers that generate the right HTML and wire everything
together.
install.packages("htmxr")

# or install the development version from GitHub:
pak::pak("hyperverse-r/htmxr")
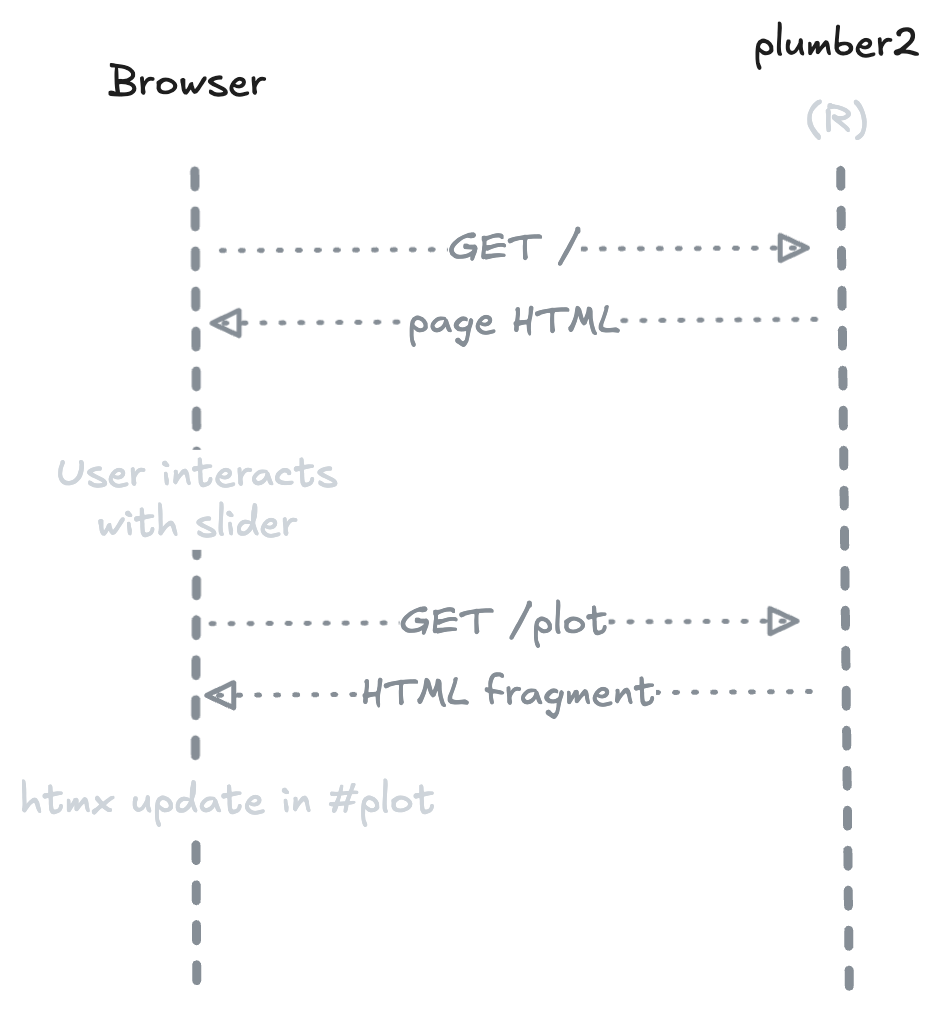
On first load, the server returns a complete HTML page. When the user interacts with an element (e.g. a slider), htmx sends a request to the R endpoint and swaps the response into the DOM — no JavaScript needed, no full page reload.
The hello example ships with {htmxr}. It
reproduces the classic Old Faithful histogram with a slider to control
the number of bins.
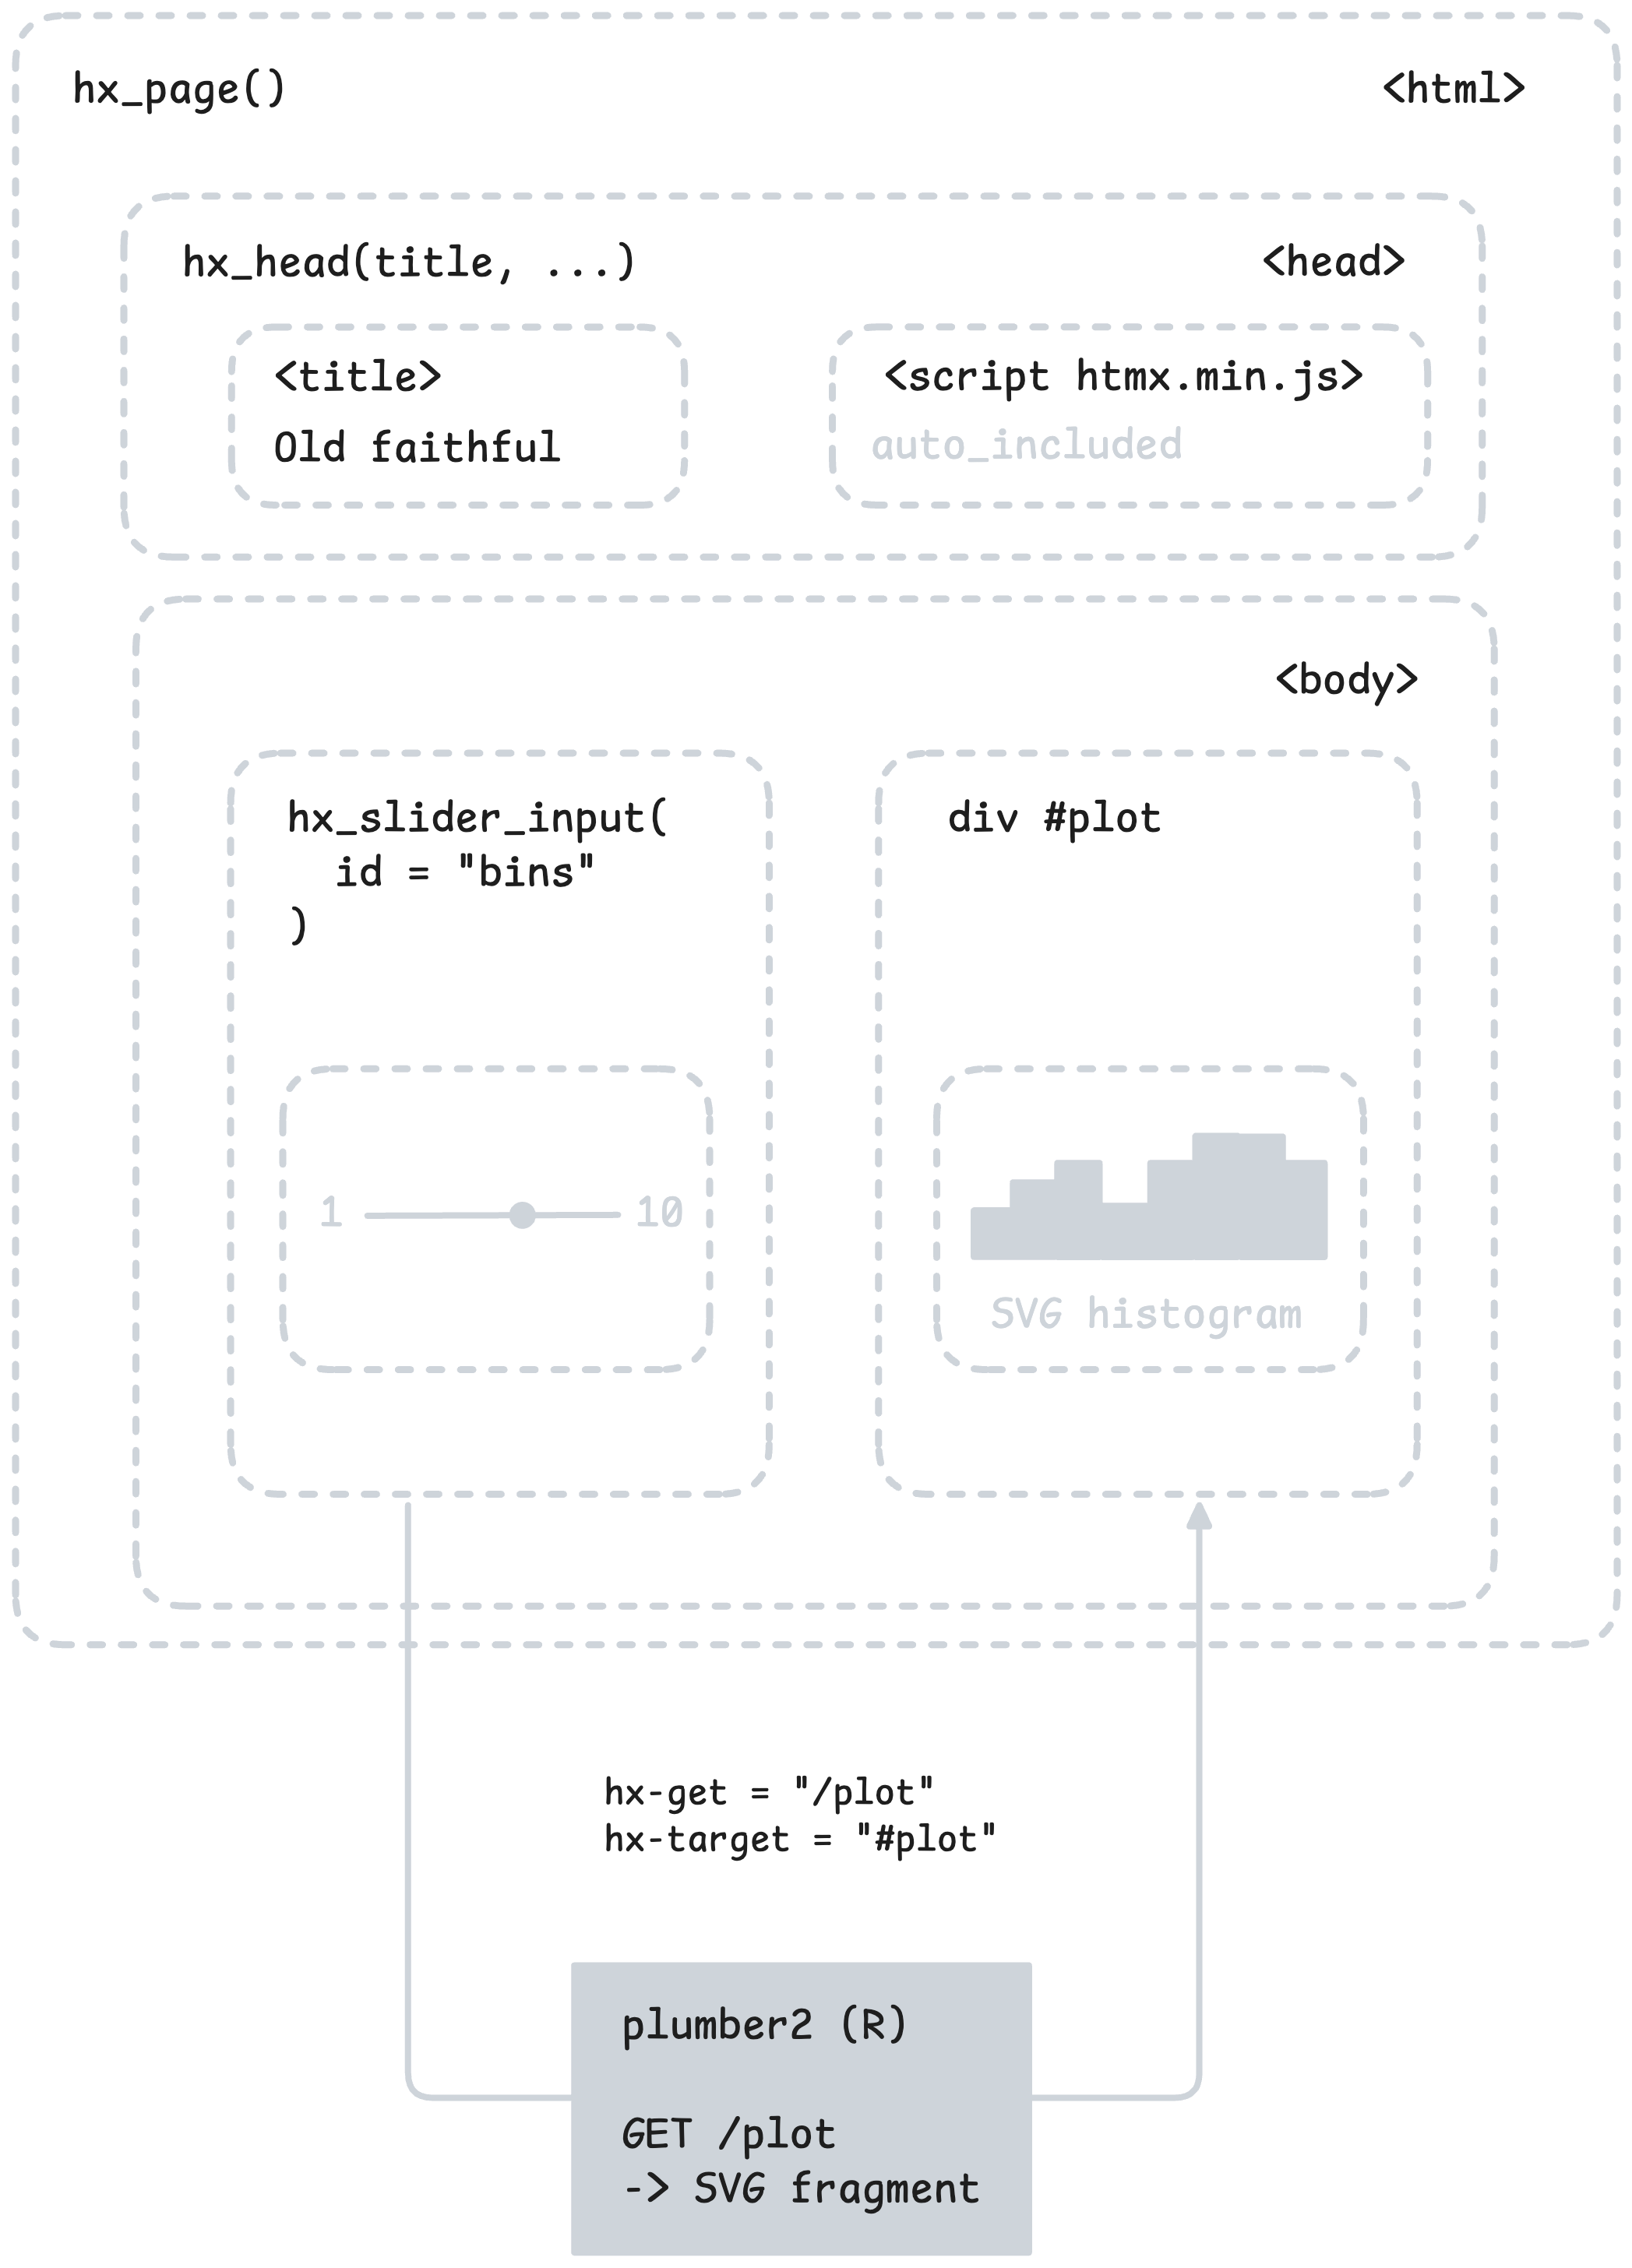
The GET / endpoint returns a full HTML page built with
hx_page() and hx_head(). The slider is created
with hx_slider_input(), which generates a
<input type="range"> wired to htmx attributes.
#* @get /
#* @parser none
#* @serializer html
function() {
  hx_page(
    hx_head(title = "Old Faithful Geyser Data", bootstrap_css),
    tags$div(
      class = "container py-5",
      # ...
      hx_slider_input(
        id = "bins",
        label = "Number of bins:",
        value = 30,
        min = 1,
        max = 50,
        get = "/plot",
        trigger = "input changed delay:300ms",
        target = "#plot"
      )
      # ...
    )
  )
}
The GET /plot endpoint is a standard plumber2 handler.
It receives the bins query parameter, generates an SVG
histogram, and returns it as an HTML fragment.
generate_plot <- function(bins = 30) {
  svg_string <- svglite::xmlSVG({
    x <- faithful[, 2]
    bins_seq <- seq(min(x), max(x), length.out = as.numeric(bins) + 1)
    hist(x, breaks = bins_seq, col = "darkgray", border = "white")
  })
  svg_string
}

#* @get /plot
#* @query bins:integer(30)
#* @parser none
#* @serializer none
function(query) {
  generate_plot(query$bins)
}
hx_run_example("hello"){htmxr} is built around a few explicit constraints:
Primitives, not a framework —
{htmxr} provides low-level building blocks. It doesn’t
impose a page structure, a routing convention, or an application model.
You compose your own app from small, predictable pieces.
HTML over abstraction — Every hx_*
function produces standard HTML elements with hx-*
attributes. There is no hidden layer, no reactivity graph, no virtual
DOM. What you write in R is what lands in the browser.
CSS-agnostic — {htmxr} doesn’t
depend on any CSS framework. Use Bootstrap, Tailwind, plain CSS, or
nothing at all.
R-centric — All logic lives in R. htmx handles client-side interactions via HTML attributes — no JavaScript required in your application code.
htmltools re-exported — tags,
div, p, etc. are available directly from
{htmxr}, so you don’t need to load {htmltools}
separately.
Please note that the htmxr project is released with a Contributor Code of Conduct. By contributing to this project, you agree to abide by its terms.
These binaries (installable software) and packages are in development.
They may not be fully stable and should be used with caution. We make no claims about them.
Health stats visible at Monitor.