The hardware and bandwidth for this mirror is donated by dogado GmbH, the Webhosting and Full Service-Cloud Provider. Check out our Wordpress Tutorial.
If you wish to report a bug, or if you are interested in having us mirror your free-software or open-source project, please feel free to contact us at mirror[@]dogado.de.
![]()
The HMS (Hierarchic Memetic Strategy) is a composite global optimization strategy consisting of a multi-population evolutionary strategy and some auxiliary methods. The HMS makes use of a dynamically-evolving data structure that provides an organization among the component populations. It is a tree with a fixed maximal height and variable internal node degree. Each component population is governed by a particular evolutionary engine. This package provides a simple R implementation with examples of using different genetic algorithms as the population engines.
This package does not provide an implementation of a Simple Genetic Algorithm to be used in demes. However the default configuration uses SGA implementation from GA package available on CRAN.
You can install the released version of hmsr from
CRAN:
install.packages("hmsr")or the development version from this repository:
install.packages("devtools")
library("devtools")
devtools::install_github("WojtAcht/hms")To run the HMS with a default configuration the only arguments that
have to be provided are the bounds of the domain: lower and
upper
library(hmsr)
f <- function(x)  (x^2+x)*cos(x)
HMS <- hms(fitness = f, lower = -10, upper = 10)
HMS@best_solution
#> [1] 6.560544There are number of parameters used for strategy configuration. The sample below runs HMS on the Eggholder function - a benchmark for optimization problems.
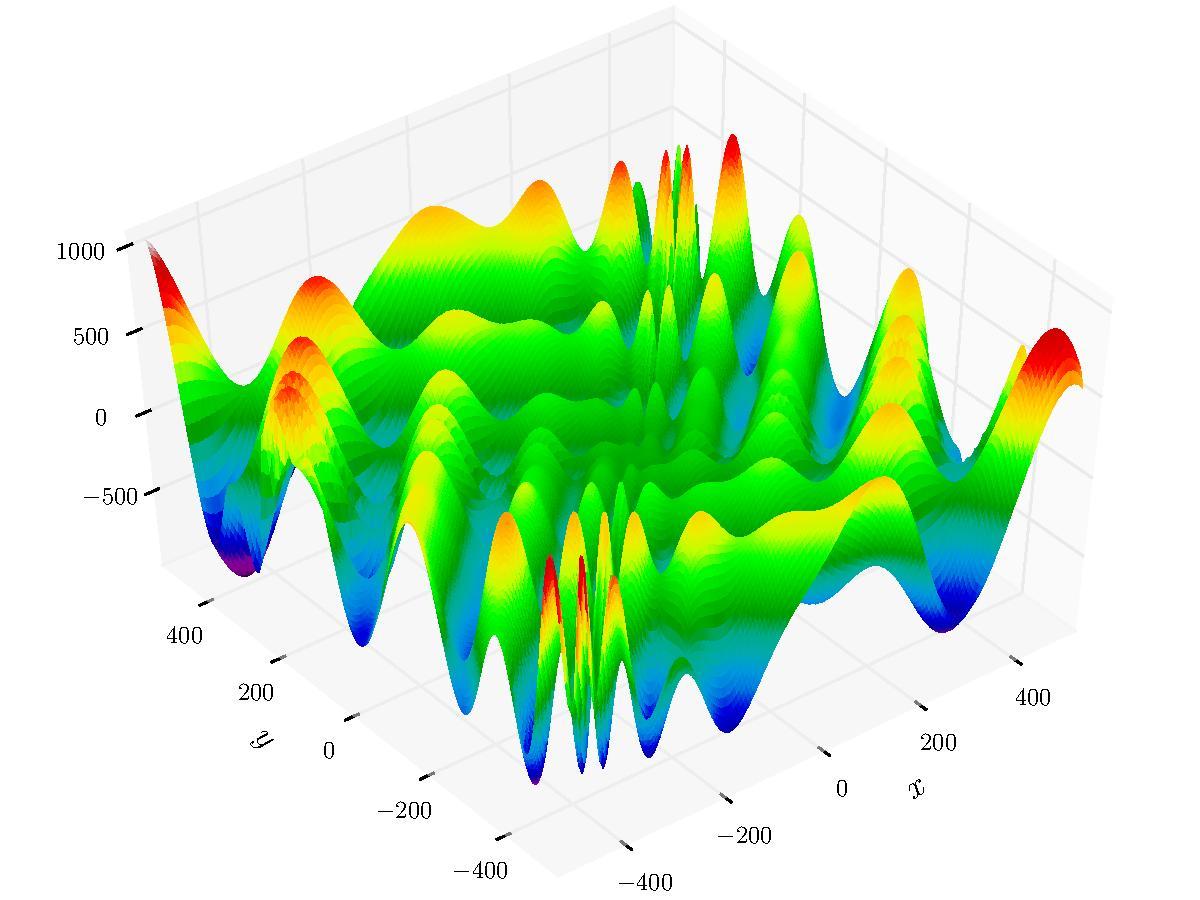
library(smoof)
Eggholder <- smoof::makeEggholderFunction()
lower <- rep(-512, 2)
upper <- rep(512, 2)
sigma <- list(rep(200, 2), rep(100, 2), rep(50, 2))
ga_config <- list(
    list(
        pmutation = 0.4,
        mutation = rtnorm_mutation(lower, upper, sigma[[1]])
    ),
    list(
        pmutation = 0.2,
        mutation = rtnorm_mutation(lower, upper, sigma[[2]])
    ),
    list(
        pmutation = 0.2,
        mutation = rtnorm_mutation(lower, upper, sigma[[3]])
    )
)
HMS <- hms(
    fitness = Eggholder,
    minimize = TRUE,
    tree_height = 3,
    lower = lower,
    upper = upper,
    run_metaepoch = ga_metaepoch(ga_config),
    population_sizes = c(50, 30, 15),
    sigma = sigma,
    gsc = gsc_max_fitness_evaluations(20000),
    sc = sc_max_metric(euclidean_distance, c(40, 20, 10)),
    lsc = lsc_metaepochs_without_improvement(15),
    monitor_level = "none",
    with_gradient_method = TRUE
)
To see the structure of demes tree at the end of the evaluation, use
printTree function
printTree(HMS)
#> f(476.52, 431.37) = 943.07 evaluations: 7675 A
#> ├-- spr: (507.90, 402.59); f(480.26, 430.74) = 956.02 evaluations: 1955 A
#> |   └-- spr: (507.49, 400.58); f(482.35, 432.88) = 956.92 evaluations: 879 A
#> ├-- spr: (479.43, 436.05); f(478.82, 429.39) = 954.55 evaluations: 2341 A
#> |   └-- spr: (480.59, 430.58); f(482.35, 432.88) = 956.92 evaluations: 1075 A
#> └-- spr: (365.96, 500.10); f(507.31, 401.35) = 938.19 evaluations: 4293 A
#>     └-- spr: (441.83, 454.04); ***f(512.00, 404.23) = 959.64*** evaluations: 2000 A
To display a plot showing how best solution has changed during the
evaluation use plot(HMS).
These binaries (installable software) and packages are in development.
They may not be fully stable and should be used with caution. We make no claims about them.
Health stats visible at Monitor.