The hardware and bandwidth for this mirror is donated by dogado GmbH, the Webhosting and Full Service-Cloud Provider. Check out our Wordpress Tutorial.
If you wish to report a bug, or if you are interested in having us mirror your free-software or open-source project, please feel free to contact us at mirror[@]dogado.de.
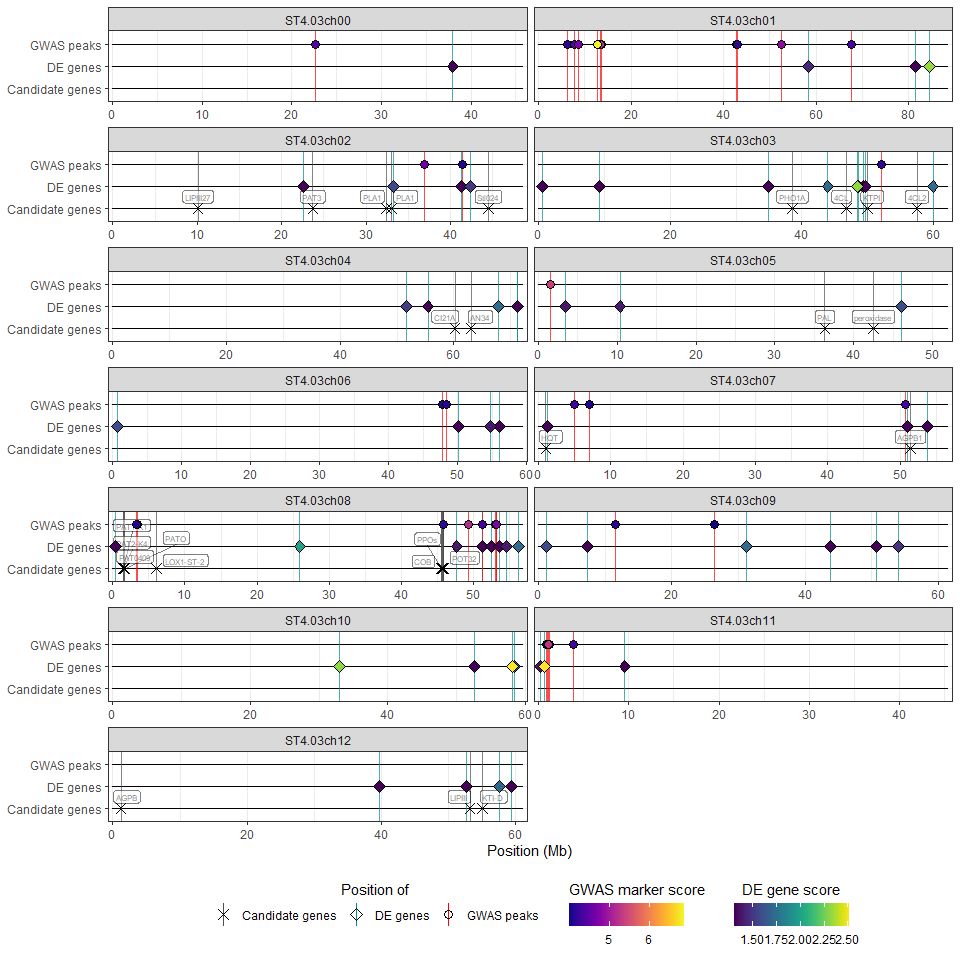
hidecan is an R package for generating HIDECAN plots,
which are visualisations summarising the results of one or more
Genome-wide association study (GWAS) and transcriptomics differential
expression (DE) analysis, alongside candidate genes of interest.
You can install the development version of hidecan from
GitHub with:
# install.packages("devtools")
devtools::install_github("PlantandFoodResearch/hidecan")The hidecan package works as follows:
it takes as an input one of more data-frames containing GWAS results, differential expression results and list of candidate genes of interest;
it computes the length of each chromosome based on the genomic position of the markers and genes provided in the input data;
it filters the datasets to retain significant markers or differentially expressed genes, according to a threshold on their score and/or log2-fold change. The fold-change is set by the user, and can be different for GWAS and differential expression results.
it displays the position of the significant markers and genes alongside candidate genes (HIDECAN plot). The plot can be customised by the user via a number of parameters (e.g. legend position or label size).
The wrapper function hidecan_plot() performs all of
these steps. Its use is demonstrated below with an example dataset:
library(hidecan)

## Getting an example dataset
x <- get_example_data()

hidecan_plot(
  gwas_list = x[["GWAS"]],          ## data-frame of GWAS results
  de_list = x[["DE"]],              ## data-frame of DE results
  can_list = x[["CAN"]],            ## data-frame of candidate genes
  score_thr_gwas = -log10(0.0001),  ## sign. threshold for GWAS
  score_thr_de = -log10(0.05),      ## sign. threshold for DE
  log2fc_thr = 0,                   ## log2FC threshold for DE
  label_size = 2                    ## label size for candidate genes
)
These binaries (installable software) and packages are in development.
They may not be fully stable and should be used with caution. We make no claims about them.
Health stats visible at Monitor.