
The hardware and bandwidth for this mirror is donated by dogado GmbH, the Webhosting and Full Service-Cloud Provider. Check out our Wordpress Tutorial.
If you wish to report a bug, or if you are interested in having us mirror your free-software or open-source project, please feel free to contact us at mirror[@]dogado.de.
The goal of ggspark is to help create ggplot2 functions that help with creating sparkline plots in the style of Edward Tufte, such as this one
Thus, the package has two main functions:
stat_interquartilerange() that draws a
geom_ribbon() between the 1st and 3rd quartile of the
variable in the y axis, and stat_sparklabels() that draws
points or text labels in the beginning, min, max, and end points of the
variable in the y axis.
You can install the development version of ggspark like so:
devtools::install_github("marcboschmatas/ggspark")The stat_sparklabels() function needs a colour scale
with three values. The first one will be using for the start and end
points of the line, the second one for the max, and the third one for
the min.
library(ggplot2)
library(ggspark)
ggplot(airquality, aes(Day, Wind, group = Month)) +
stat_interquartilerange(geom = "ribbon",
show.legend = FALSE) +
geom_line() +
stat_sparklabels(geom = "label",
show.legend = FALSE) +
scale_colour_manual("", values = c("black", "blue", "red")) +
scale_y_continuous(limits = c(0, 25)) +
facet_grid(Month~.) +
ggtitle("Daily wind intensity by month in NYC") +
theme_minimal() +
theme(panel.grid = element_blank(),
axis.ticks = element_line())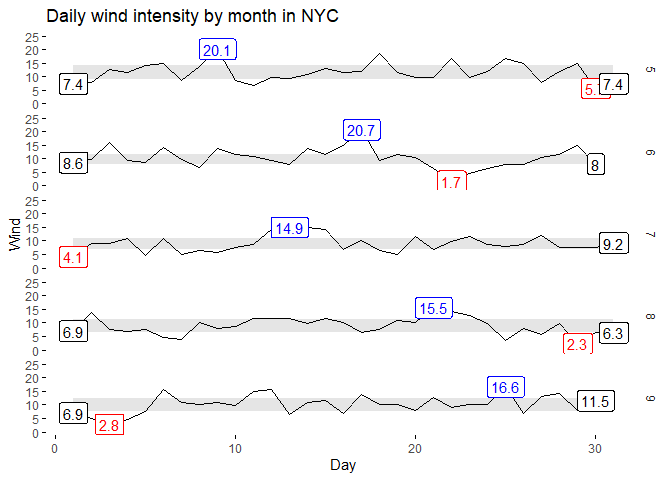 It has an
optional
It has an
optional label_fun parameter that allows to modify the
label aesthetics (such as rounding, adding percentage or currency
suffixes and prefixes…).
library(ggplot2)
library(ggspark)
ggplot(airquality, aes(Day, Wind, group = Month)) +
  stat_interquartilerange(geom = "ribbon",
                          show.legend = FALSE) +
  geom_line() +
  stat_sparklabels(geom = "label", label_fun = \(x) round(x, 0),
                   show.legend = FALSE) +
  scale_colour_manual("", values = c("black", "blue", "red")) +
  scale_y_continuous(limits = c(0, 25)) +
  facet_grid(Month~.) +
  ggtitle("Daily wind intensity by month in NYC") +
  theme_minimal() +
  theme(panel.grid = element_blank(),
        axis.ticks = element_line())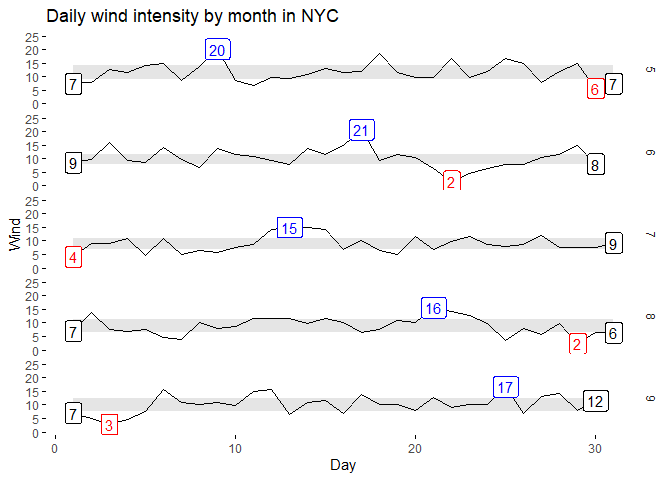
It is also possible to use points instead of labels.
library(ggrepel)
#> Warning: package 'ggrepel' was built under R version 4.3.3
ggplot(airquality, aes(Day, Wind, group = Month)) +
  stat_interquartilerange(geom = "ribbon",
                          show.legend = FALSE) +
  geom_line() +
  stat_sparklabels(geom = "point",
                   show.legend = FALSE) +
  scale_colour_manual("", values = c("black", "blue", "red")) +
  scale_y_continuous(limits = c(0, 25)) +
  facet_grid(Month~.) +
  ggtitle("Daily wind intensity by month in NYC") +
  theme_minimal() +
  theme(panel.grid = element_blank(),
        axis.ticks = element_line())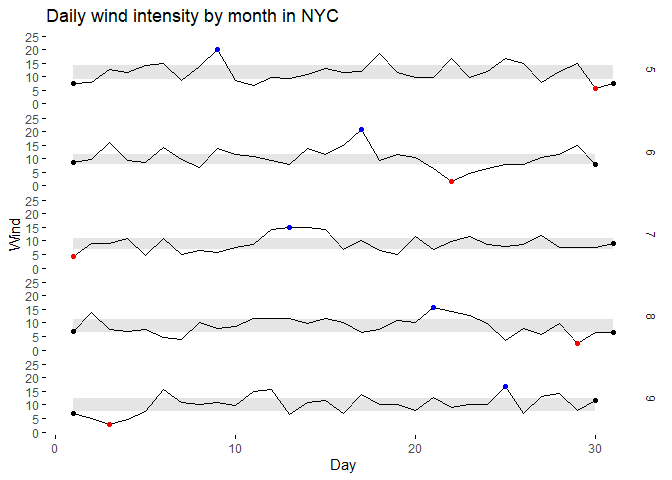
With ggrepel, it is possible to combine both text and dots.
library(ggrepel)
ggplot(airquality, aes(Day, Wind, group = Month)) +
  stat_interquartilerange(geom = "ribbon",
                          show.legend = FALSE) +
  geom_line() +
  stat_sparklabels(geom = "point", label_fun = \(x) round(x, 0),
                   show.legend = FALSE) +
    stat_sparklabels(geom = "text_repel", label_fun = \(x) round(x, 0),
                   show.legend = FALSE) +
  scale_colour_manual("", values = c("black", "blue", "red")) +
  scale_y_continuous(limits = c(0, 25)) +
  facet_grid(Month~.) +
  ggtitle("Daily wind intensity by month in NYC") +
  theme_minimal() +
  theme(panel.grid = element_blank(),
        axis.ticks = element_line())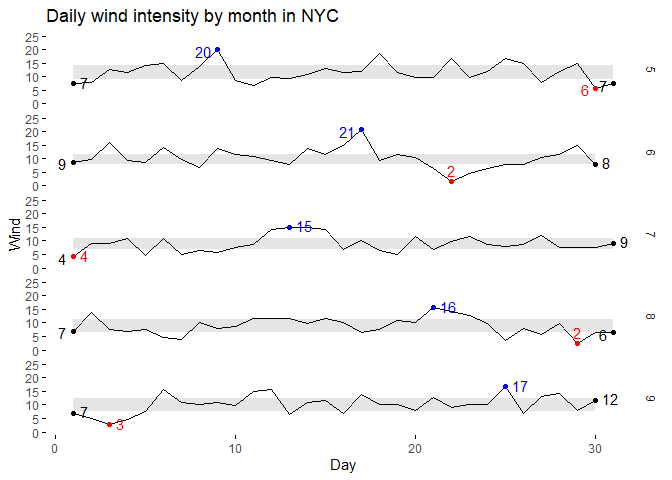
These binaries (installable software) and packages are in development.
They may not be fully stable and should be used with caution. We make no claims about them.
Health stats visible at Monitor.