
The hardware and bandwidth for this mirror is donated by dogado GmbH, the Webhosting and Full Service-Cloud Provider. Check out our Wordpress Tutorial.
If you wish to report a bug, or if you are interested in having us mirror your free-software or open-source project, please feel free to contact us at mirror[@]dogado.de.
![]()
![]()
Ridgeline plots are partially overlapping line plots that create the impression of a mountain range. They can be quite useful for visualizing changes in distributions over time or space.
Please install the stable release from CRAN:
install.packages("ggridges")Alternatively, you can install the latest development version from github:
remotes::install_github("wilkelab/ggridges")library(ggplot2)
library(ggridges)
ggplot(diamonds, aes(x = price, y = cut)) +
geom_density_ridges(scale = 4) +
scale_y_discrete(expand = c(0, 0)) + # will generally have to set the `expand` option
scale_x_continuous(expand = c(0, 0)) + # for both axes to remove unneeded padding
coord_cartesian(clip = "off") + # to avoid clipping of the very top of the top ridgeline
theme_ridges()
#> Picking joint bandwidth of 458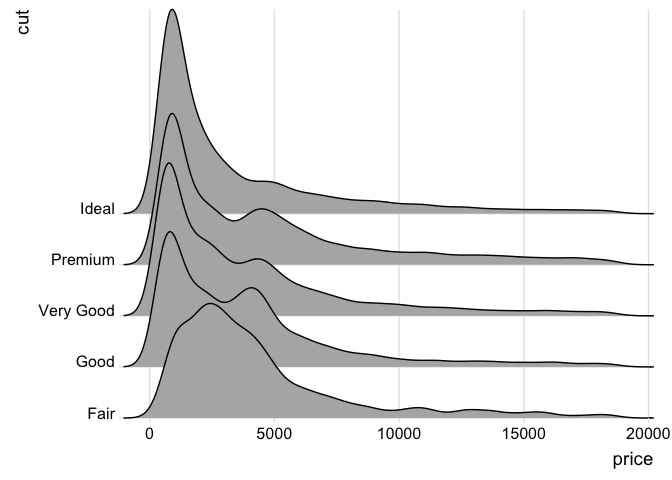
First read the package vignette. Then read the reference manual.
These binaries (installable software) and packages are in development.
They may not be fully stable and should be used with caution. We make no claims about them.
Health stats visible at Monitor.