The hardware and bandwidth for this mirror is donated by dogado GmbH, the Webhosting and Full Service-Cloud Provider. Check out our Wordpress Tutorial.
If you wish to report a bug, or if you are interested in having us mirror your free-software or open-source project, please feel free to contact us at mirror[@]dogado.de.
![]()
![]()
ggredist provides ggplot2 extensions for
political mapmaking, including new geometries, easy label generation and
placement, automatic map coloring, and map scales, palettes, and
themes.
Here’s an example of what you can do with the package.
library(ggredist)
library(ggplot2)

data(oregon)

ggplot(oregon, aes(group=cd_2020)) +
  # 'ndv' and 'nrv' contain D and R vote counts
  geom_district(aes(fill=ndv, denom=ndv+nrv), linewidth=0.9) +
  geom_district_text() +
  # can then highlight towns and cities
  geom_places(state = 'OR') +
  # we can overlay county boundaries and labels
  geom_district(aes(group=county), linewidth=0.2, linetype="dashed", fill=NA) +
  geom_district_text(aes(group=county, label=toupper(county)),
                     size=2.2, check_overlap=TRUE) +
  scale_fill_party_b(limits=c(0.4, 0.6)) +
  theme_map()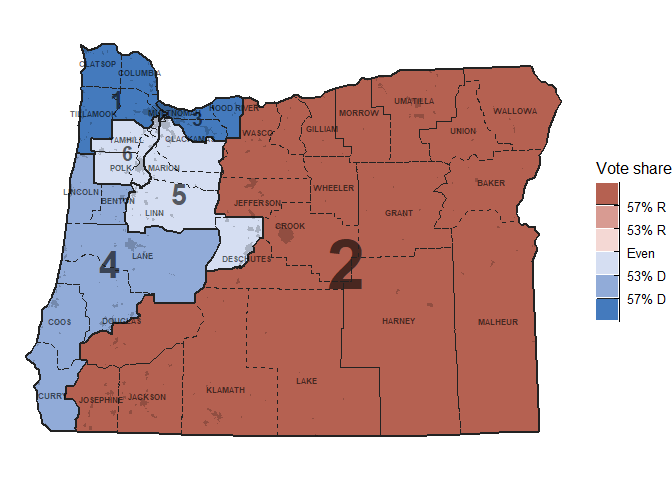
See more in the reference.
You can install the development version of ggredist from GitHub with:
# install.packages("remotes")
remotes::install_github("alarm-redist/ggredist")
These binaries (installable software) and packages are in development.
They may not be fully stable and should be used with caution. We make no claims about them.
Health stats visible at Monitor.