The hardware and bandwidth for this mirror is donated by dogado GmbH, the Webhosting and Full Service-Cloud Provider. Check out our Wordpress Tutorial.
If you wish to report a bug, or if you are interested in having us mirror your free-software or open-source project, please feel free to contact us at mirror[@]dogado.de.
![]()
Quiver plots for ggplot2. An extension of ‘ggplot2’ to provide quiver plots to visualise vector fields. This functionality is implemented using a geom to produce a new graphical layer, which allows aesthetic options. This layer can be overlaid on a map to improve visualisation of mapped data.
The stable version can be installed from CRAN:
install.packages("ggquiver")The development version can be installed from GitHub using:
# install.packages("remotes")
remotes::install_github("mitchelloharawild/ggquiver")ggquiver introduces a new geom geom_quiver(),
which produces a quiver plot in ggplot2.
Quiver plots for functions can easily be produced using ggplot aeshetics. When a grid is detected, the size of the vectors are automatically adjusted to fit within the grid.
library(ggplot2)
library(ggquiver)
expand.grid(x=seq(0,pi,pi/12), y=seq(0,pi,pi/12)) %>%
  ggplot(aes(x=x,y=y,u=cos(x),v=sin(y))) +
  geom_quiver()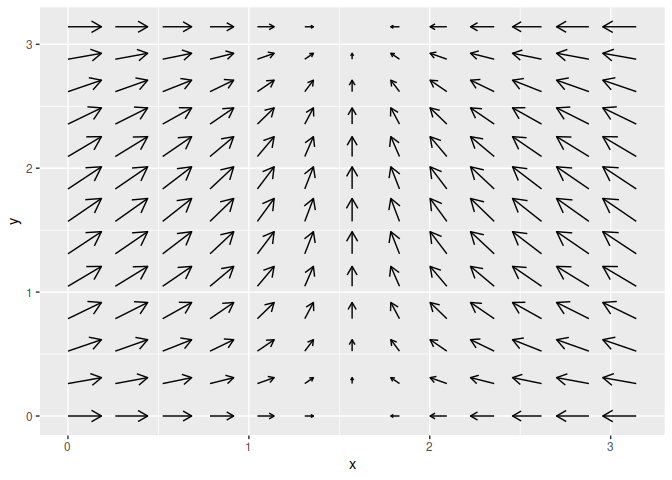
The ggplot2 example for seal movements is easily reproduced, with appropriately scaled arrowhead sizes. Here, the vecsize is set to zero to not resize the vectors.
ggplot(seals, aes(x=long, y=lat, u=delta_long, v=delta_lat)) +
  geom_quiver(vecsize=0) +
  borders("state")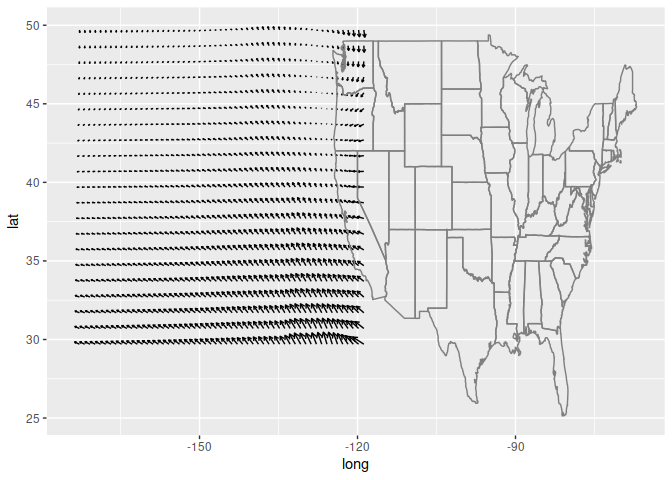
Quiver plot arrows can be centered about x and y coordinates, which is useful when working with maps and scaled vectors.
ggplot(seals, aes(x=long, y=lat, u=delta_long, v=delta_lat)) +
  geom_quiver(vecsize=0, center = TRUE) +
  borders("state")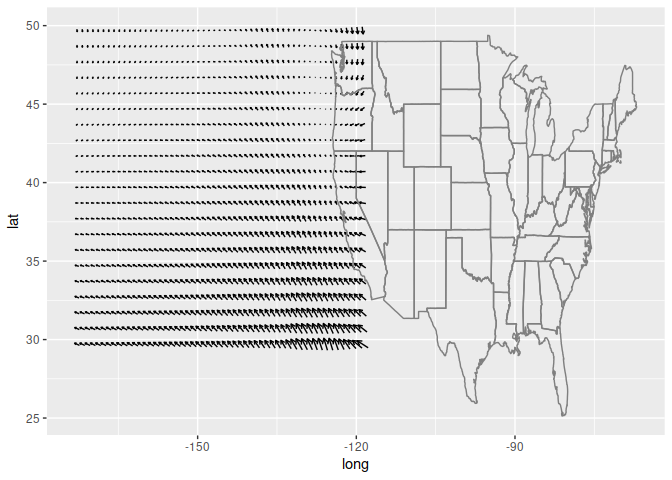
These binaries (installable software) and packages are in development.
They may not be fully stable and should be used with caution. We make no claims about them.
Health stats visible at Monitor.