The hardware and bandwidth for this mirror is donated by dogado GmbH, the Webhosting and Full Service-Cloud Provider. Check out our Wordpress Tutorial.
If you wish to report a bug, or if you are interested in having us mirror your free-software or open-source project, please feel free to contact us at mirror[@]dogado.de.
![]()
![]()
ggforestplotR provides a ggplot2-first
workflow for building forest plots from tidy coefficient tables or
fitted model objects.
install.packages("ggforestplotR")#install.packages("remotes")
remotes::install_github("thatoneguy006/ggforestplotR")ggforestplotR currently supports two core workflows:
library(ggforestplotR)
library(ggplot2)
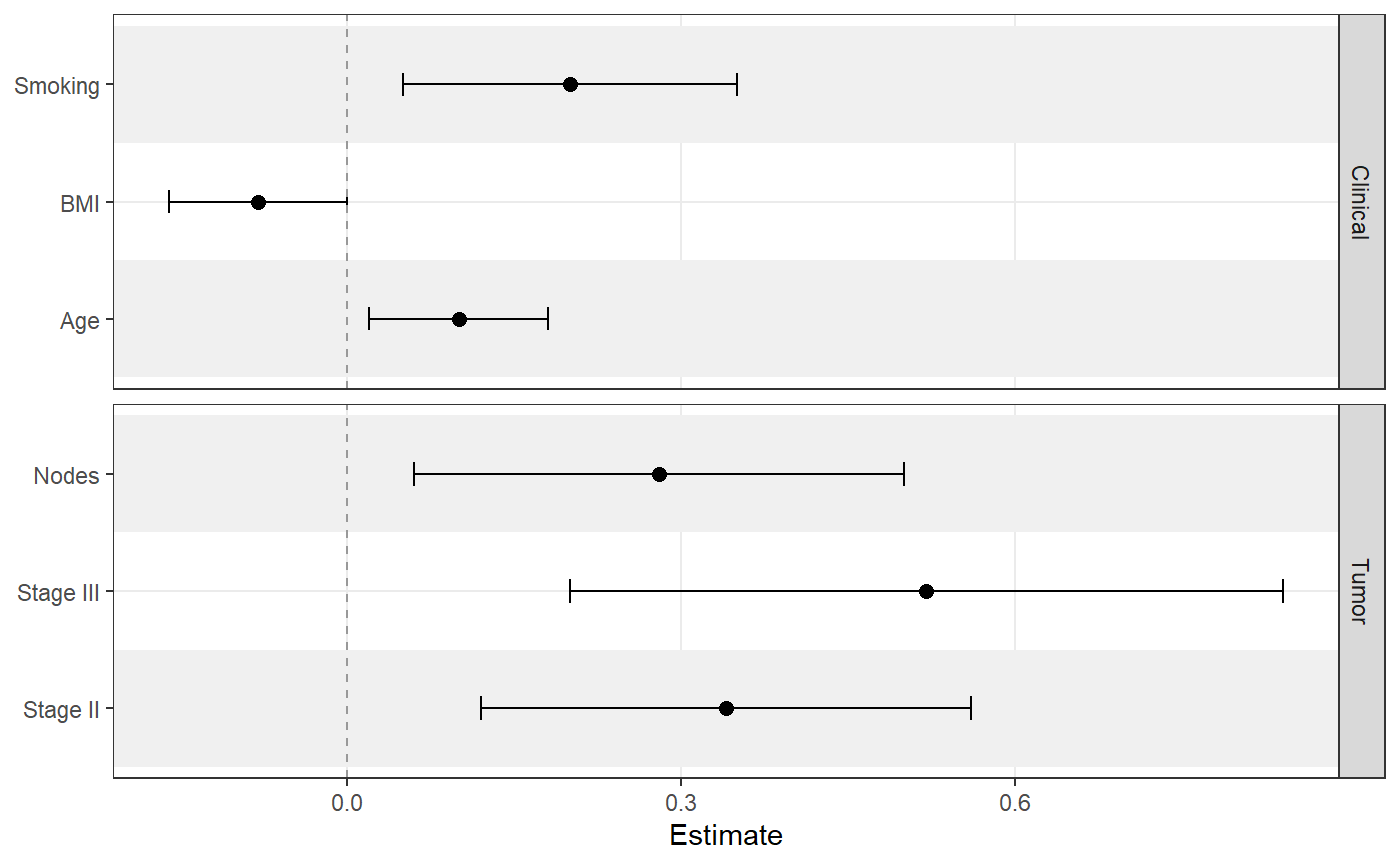
sectioned_coefs <- data.frame(
term = c("Age", "BMI", "Smoking", "Stage II", "Stage III", "Nodes"),
estimate = c(0.10, -0.08, 0.20, 0.34, 0.52, 0.28),
conf.low = c(0.02, -0.16, 0.05, 0.12, 0.20, 0.06),
conf.high = c(0.18, 0.00, 0.35, 0.56, 0.84, 0.50),
section = c("Clinical", "Clinical", "Clinical", "Tumor", "Tumor", "Tumor")
)
ggforestplot(
sectioned_coefs,
facet = "section",
striped_rows = TRUE,
stripe_fill = "grey94",
facet_strip_position = "right"
)
ggforestplot(
  sectioned_coefs,
  striped_rows = TRUE,
  stripe_fill = "grey94"
) +
  add_forest_table()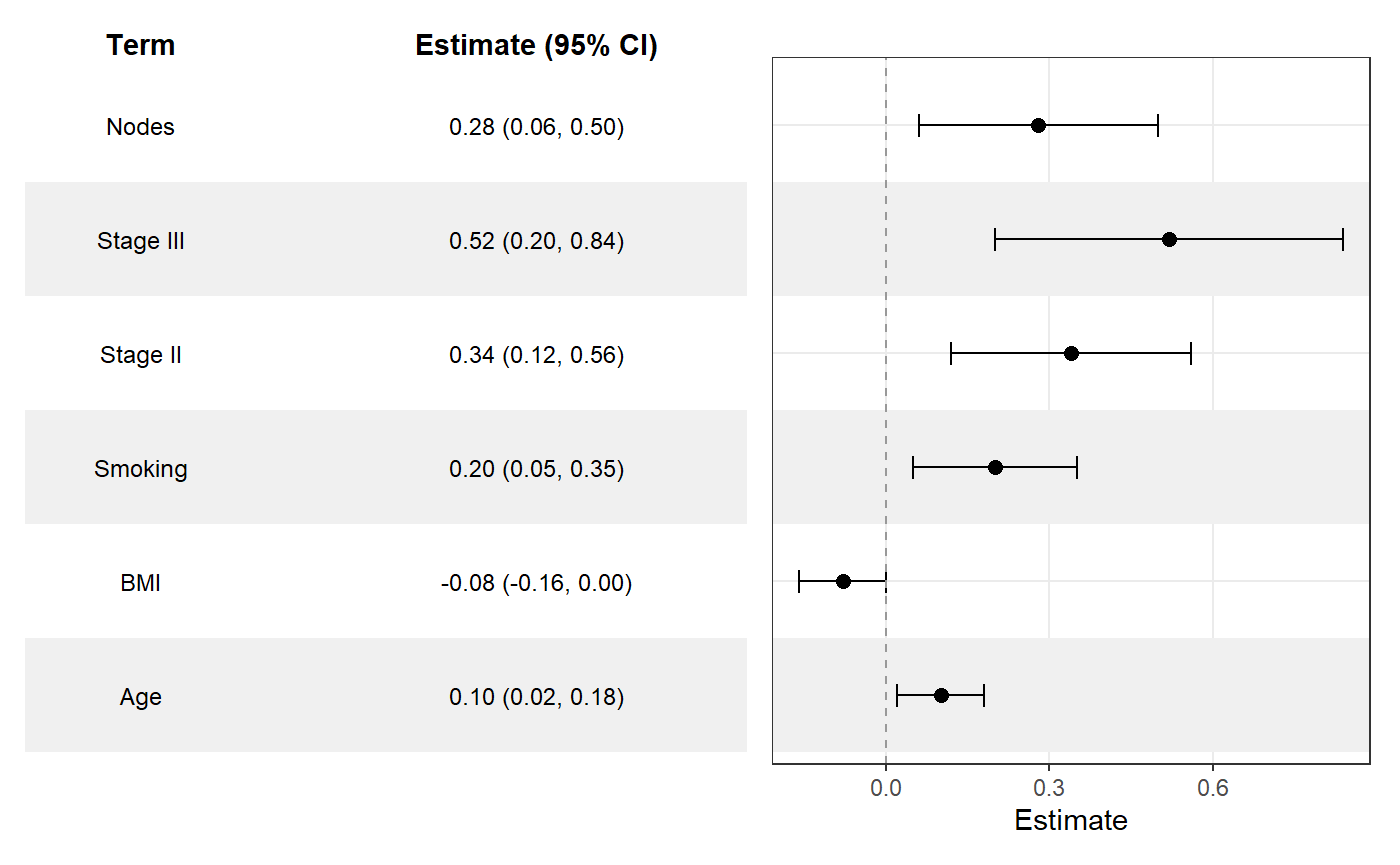
ggforestplot(
  sectioned_coefs,
  striped_rows = TRUE,
  stripe_fill = "grey94"
) +
  add_split_table()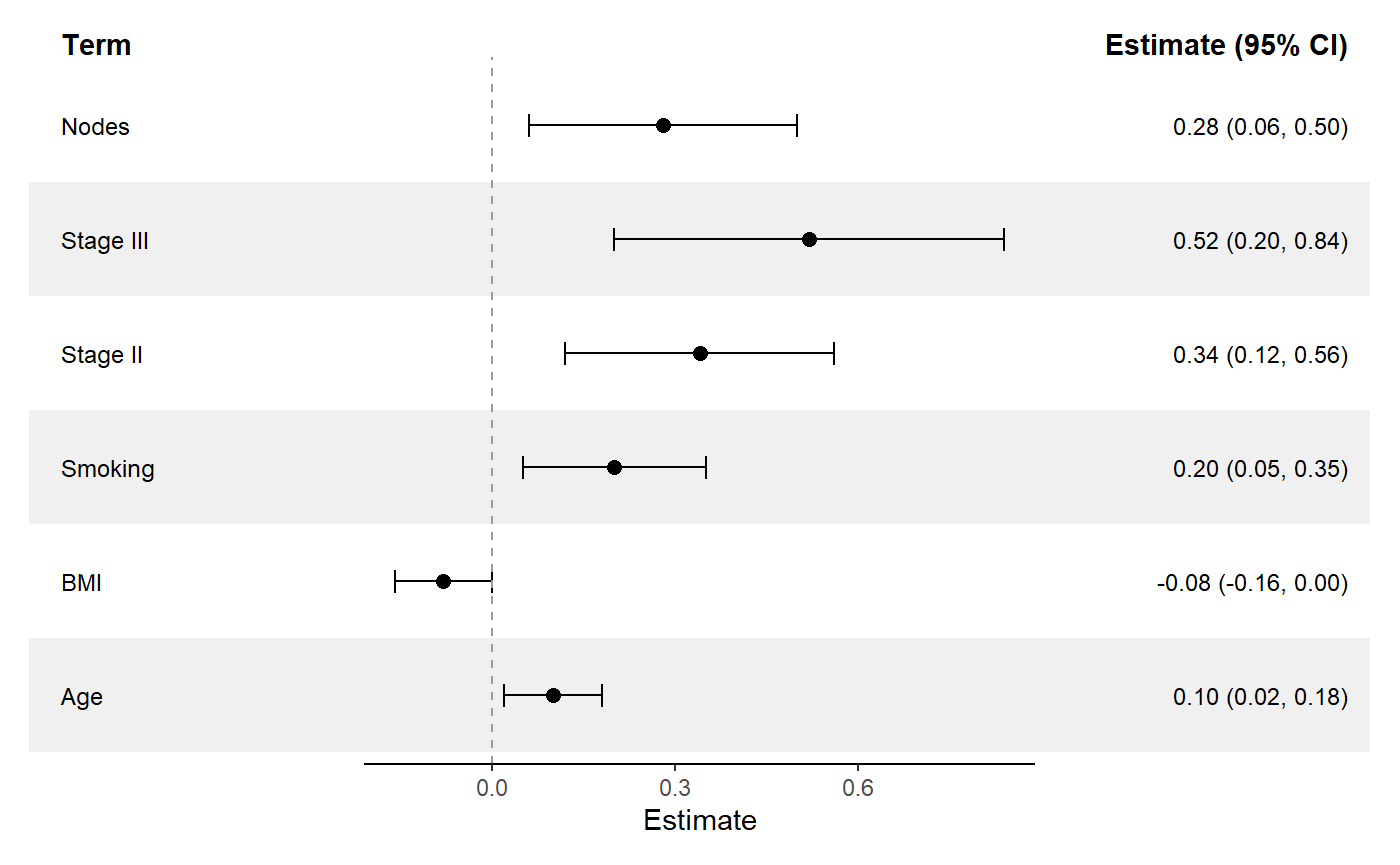
ggforestplot() builds the plotting panel from a data
frame or supported model object.add_forest_table() attaches a summary table to the left
or right side of the plot.add_split_table() creates a more traditional forestplot
layout with table columns on both sides of the plot.as_forest_data() standardizes custom coefficient
data.tidy_forest_model() converts fitted models into
plotting-ready coefficient data.These binaries (installable software) and packages are in development.
They may not be fully stable and should be used with caution. We make no claims about them.
Health stats visible at Monitor.