The hardware and bandwidth for this mirror is donated by dogado GmbH, the Webhosting and Full Service-Cloud Provider. Check out our Wordpress Tutorial.
If you wish to report a bug, or if you are interested in having us mirror your free-software or open-source project, please feel free to contact us at mirror[@]dogado.de.
![]()
![]()
ggExametrika provides ggplot2-based visualization for the exametrika package. It supports a wide range of psychometric models:
| Model | Description |
|---|---|
| IRT | Item Response Theory (2PL, 3PL, 4PL) |
| GRM | Graded Response Model |
| LCA | Latent Class Analysis |
| LRA | Latent Rank Analysis |
| LRAordinal | Latent Rank Analysis for ordinal data |
| LRArated | Latent Rank Analysis for rated data |
| Biclustering | Simultaneous item/student clustering (binary) |
| nominalBiclustering | Biclustering for nominal data |
| ordinalBiclustering | Biclustering for ordinal data |
| IRM | Infinite Relational Model |
| LDLRA | Locally Dependent Latent Rank Analysis |
| LDB | Locally Dependent Biclustering |
| BINET | Bayesian Network and Test |
| BNM | Bayesian Network Model |
Shojima, Kojiro (2022) Test Data Engineering: Latent Rank Analysis, Biclustering, and Bayesian Network (Behaviormetrics: Quantitative Approaches to Human Behavior, 13), Springer, ISBN 978-981-16-9985-6
# install.packages("devtools")
devtools::install_github("kosugitti/ggExametrika")All plot functions take exametrika output directly and return ggplot
objects. Functions are named plotXXX_gg().
library(exametrika)
library(ggExametrika)

result_irt <- IRT(J15S500, model = 3)
plots <- plotICC_gg(result_irt)
plots[[5]]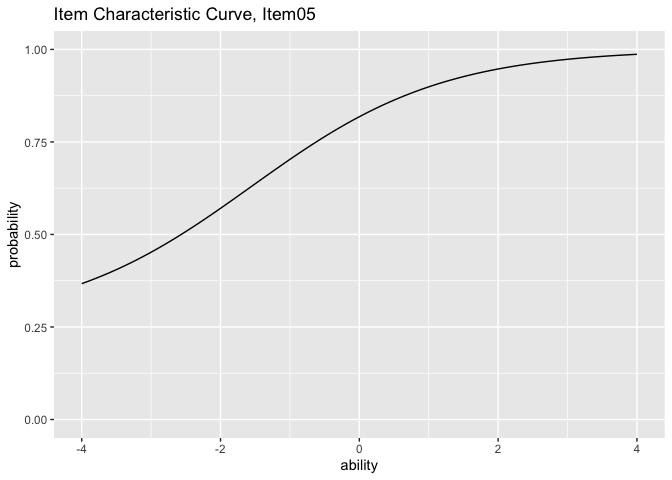
combinePlots_gg(plots)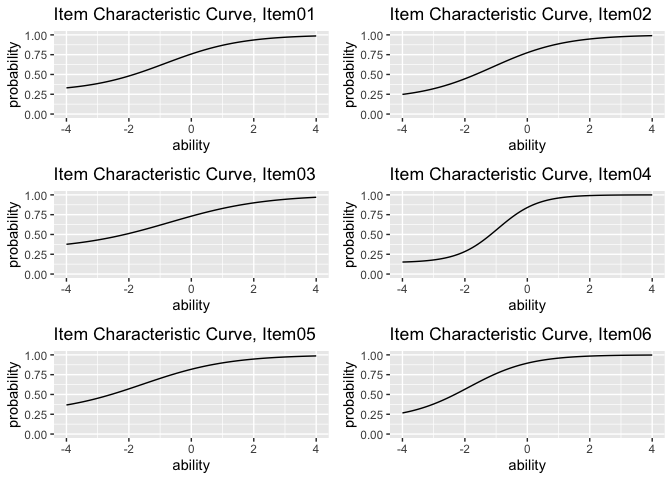
# All ICCs on a single plot
plotICC_overlay_gg(result_irt, show_legend = TRUE)

# All IICs on a single plot (also works with GRM)
plotIIC_overlay_gg(result_irt, items = c(1, 3, 5), show_legend = TRUE)plots <- plotIIC_gg(result_irt)
combinePlots_gg(plots, selectPlots = 8:11)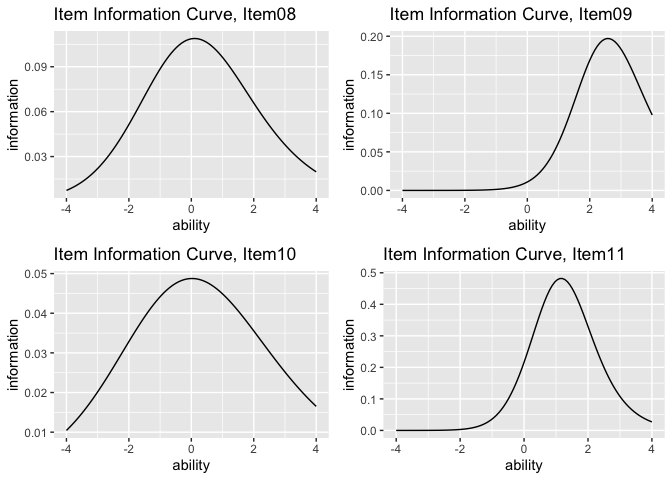
plotTIC_gg(result_irt)
plotTRF_gg(result_irt)result_grm <- GRM(J5S1000)
plots <- plotICRF_gg(result_grm)
plots[[1]]
combinePlots_gg(plots, selectPlots = 1:5)
# GRM also supports IIC and TIC
plotIIC_gg(result_grm)
plotTIC_gg(result_grm)result_lca <- LCA(J15S500, ncls = 3)
plotIRP_gg(result_lca) # Item Reference Profile
plotFRP_gg(result_lca) # Field Reference Profile
plotTRP_gg(result_lca) # Test Reference Profile
plotLCD_gg(result_lca) # Latent Class Distribution
plotCMP_gg(result_lca) # Class Membership Profileresult_lra <- LRA(J15S500, nrank = 4)
plotIRP_gg(result_lra) # Item Reference Profile
plotFRP_gg(result_lra) # Field Reference Profile
plotTRP_gg(result_lra) # Test Reference Profile
plotLRD_gg(result_lra) # Latent Rank Distribution
plotRMP_gg(result_lra) # Rank Membership Profileresult_lra_ord <- LRA(J5S1000, nrank = 4) # ordinal data
plotScoreFreq_gg(result_lra_ord) # Score Frequency Distribution
plotScoreRank_gg(result_lra_ord) # Score-Rank Heatmap
plotICRP_gg(result_lra_ord) # Item Category Reference Profile
plotICBR_gg(result_lra_ord) # Item Category Boundary Response (ordinal only)
plotRMP_gg(result_lra_ord) # Rank Membership Profileresult_bic <- Biclustering(J35S515, nfld = 5, nrank = 6)
plotFRP_gg(result_bic) # Field Reference Profile
plotTRP_gg(result_bic) # Test Reference Profile
plotLCD_gg(result_bic) # Latent Class Distribution
plotLRD_gg(result_bic) # Latent Rank Distribution
plotCMP_gg(result_bic) # Class Membership Profile
plotRMP_gg(result_bic) # Rank Membership Profile
plotCRV_gg(result_bic) # Class Reference Vector
plotRRV_gg(result_bic) # Rank Reference Vector
plotArray_gg(result_bic) # Array Plot (heatmap)# Nominal Biclustering
result_nom <- Biclustering(data, ncls = 3, nfld = 4)
plotFRP_gg(result_nom, stat = "mean") # stat: "mean", "median", or "mode"
plotFCRP_gg(result_nom, style = "line") # Field Category Response Profile (style: "line" or "bar")
plotScoreField_gg(result_nom) # Expected Score Heatmap (field x class/rank)
plotCRV_gg(result_nom, stat = "mean") # Class Reference Vector
plotRRV_gg(result_nom, stat = "mean") # Rank Reference Vector
plotArray_gg(result_nom) # Array Plot
# Ordinal Biclustering (additional)
plotFCBR_gg(result_ord) # Field Cumulative Boundary Reference (ordinal only)result_ldb <- LDB(J35S515, ncls = 6, nfld = 5)
plotFRP_gg(result_ldb) # Field Reference Profile
plotTRP_gg(result_ldb) # Test Reference Profile
plotLRD_gg(result_ldb) # Latent Rank Distribution
plotRMP_gg(result_ldb) # Rank Membership Profile
plotArray_gg(result_ldb) # Array Plot
plotFieldPIRP_gg(result_ldb) # Field Parent Item Reference Profile
plotGraph_gg(result_ldb) # DAG per rankresult_binet <- BINET(J35S515, ncls = 6, nfld = 5)
plotFRP_gg(result_binet) # Field Reference Profile
plotTRP_gg(result_binet) # Test Reference Profile
plotLRD_gg(result_binet) # Latent Rank Distribution
plotRMP_gg(result_binet) # Rank Membership Profile
plotArray_gg(result_binet) # Array Plot
plotGraph_gg(result_binet, show_edge_label = TRUE) # DAG with edge labelsresult_bnm <- BNM(J15S500)
plotGraph_gg(result_bnm)
result_ldlra <- LDLRA(J15S500, ncls = 5)
plotGraph_gg(result_ldlra) # One DAG per rank| Function | IRT | GRM |
|---|---|---|
| plotICC_gg | x | |
| plotICC_overlay_gg | x | |
| plotIIC_gg | x | x |
| plotIIC_overlay_gg | x | x |
| plotTIC_gg | x | x |
| plotTRF_gg | x | |
| plotICRF_gg | x |
| Function | LCA | LRA | LRAordinal | LRArated |
|---|---|---|---|---|
| plotIRP_gg | x | x | ||
| plotFRP_gg | x | x | ||
| plotTRP_gg | x | x | ||
| plotLCD_gg | x | |||
| plotLRD_gg | x | |||
| plotCMP_gg | x | |||
| plotRMP_gg | x | x | x | |
| plotScoreFreq_gg | x | x | ||
| plotScoreRank_gg | x | x | ||
| plotICRP_gg | x | x | ||
| plotICBR_gg | x |
| Function | Bic. | nomBic. | ordBic. | IRM |
|---|---|---|---|---|
| plotFRP_gg | x | x | x | x |
| plotTRP_gg | x | x | ||
| plotLCD_gg | x | x | x | |
| plotLRD_gg | x | x | x | |
| plotCMP_gg | x | x | x | |
| plotRMP_gg | x | x | ||
| plotCRV_gg | x | x | x | |
| plotRRV_gg | x | x | x | |
| plotArray_gg | x | x | x | x |
| plotFCRP_gg | x | x | ||
| plotFCBR_gg | x | |||
| plotScoreField_gg | x | x |
| Function | LDLRA | LDB | BINET | BNM |
|---|---|---|---|---|
| plotIRP_gg | x | |||
| plotFRP_gg | x | x | ||
| plotTRP_gg | x | x | ||
| plotLRD_gg | x | x | x | |
| plotRMP_gg | x | x | x | |
| plotArray_gg | x | x | ||
| plotFieldPIRP_gg | x | |||
| plotGraph_gg | x | x | x | x |
| Function | Description |
|---|---|
| combinePlots_gg | Arrange multiple plots in a grid |
All plot functions support these customization options:
| Parameter | Description | Default |
|---|---|---|
title |
TRUE (auto), FALSE (none), or character
string |
TRUE |
colors |
Color vector (colorblind-friendly default) | auto |
linetype |
"solid", "dashed", "dotted",
etc. |
"solid" |
show_legend |
Show/hide legend | TRUE |
legend_position |
"right", "top", "bottom",
"left" |
"right" |
Some functions have additional parameters:
| Parameter | Functions | Description |
|---|---|---|
stat |
plotFRP_gg, plotCRV_gg, plotRRV_gg | "mean", "median", or "mode"
for polytomous data |
style |
plotFCRP_gg | "line" or "bar" |
show_labels |
plotRRV_gg | Show value labels (uses ggrepel) |
These binaries (installable software) and packages are in development.
They may not be fully stable and should be used with caution. We make no claims about them.
Health stats visible at Monitor.