The hardware and bandwidth for this mirror is donated by dogado GmbH, the Webhosting and Full Service-Cloud Provider. Check out our Wordpress Tutorial.
If you wish to report a bug, or if you are interested in having us mirror your free-software or open-source project, please feel free to contact us at mirror[@]dogado.de.

![]()
⌚️ A faster
unique()function
You can install the released version of funique from Github with:
## install remotes pkg if not already
if (!requireNamespace("remotes", quietly = TRUE)) {
  install.packages("remotes")
}

## install funique from github
remotes::install_github("mkearney/funique")There’s one function funique(), which is the same as
base::unique() only optimized to be faster when data
contain date-time variables.
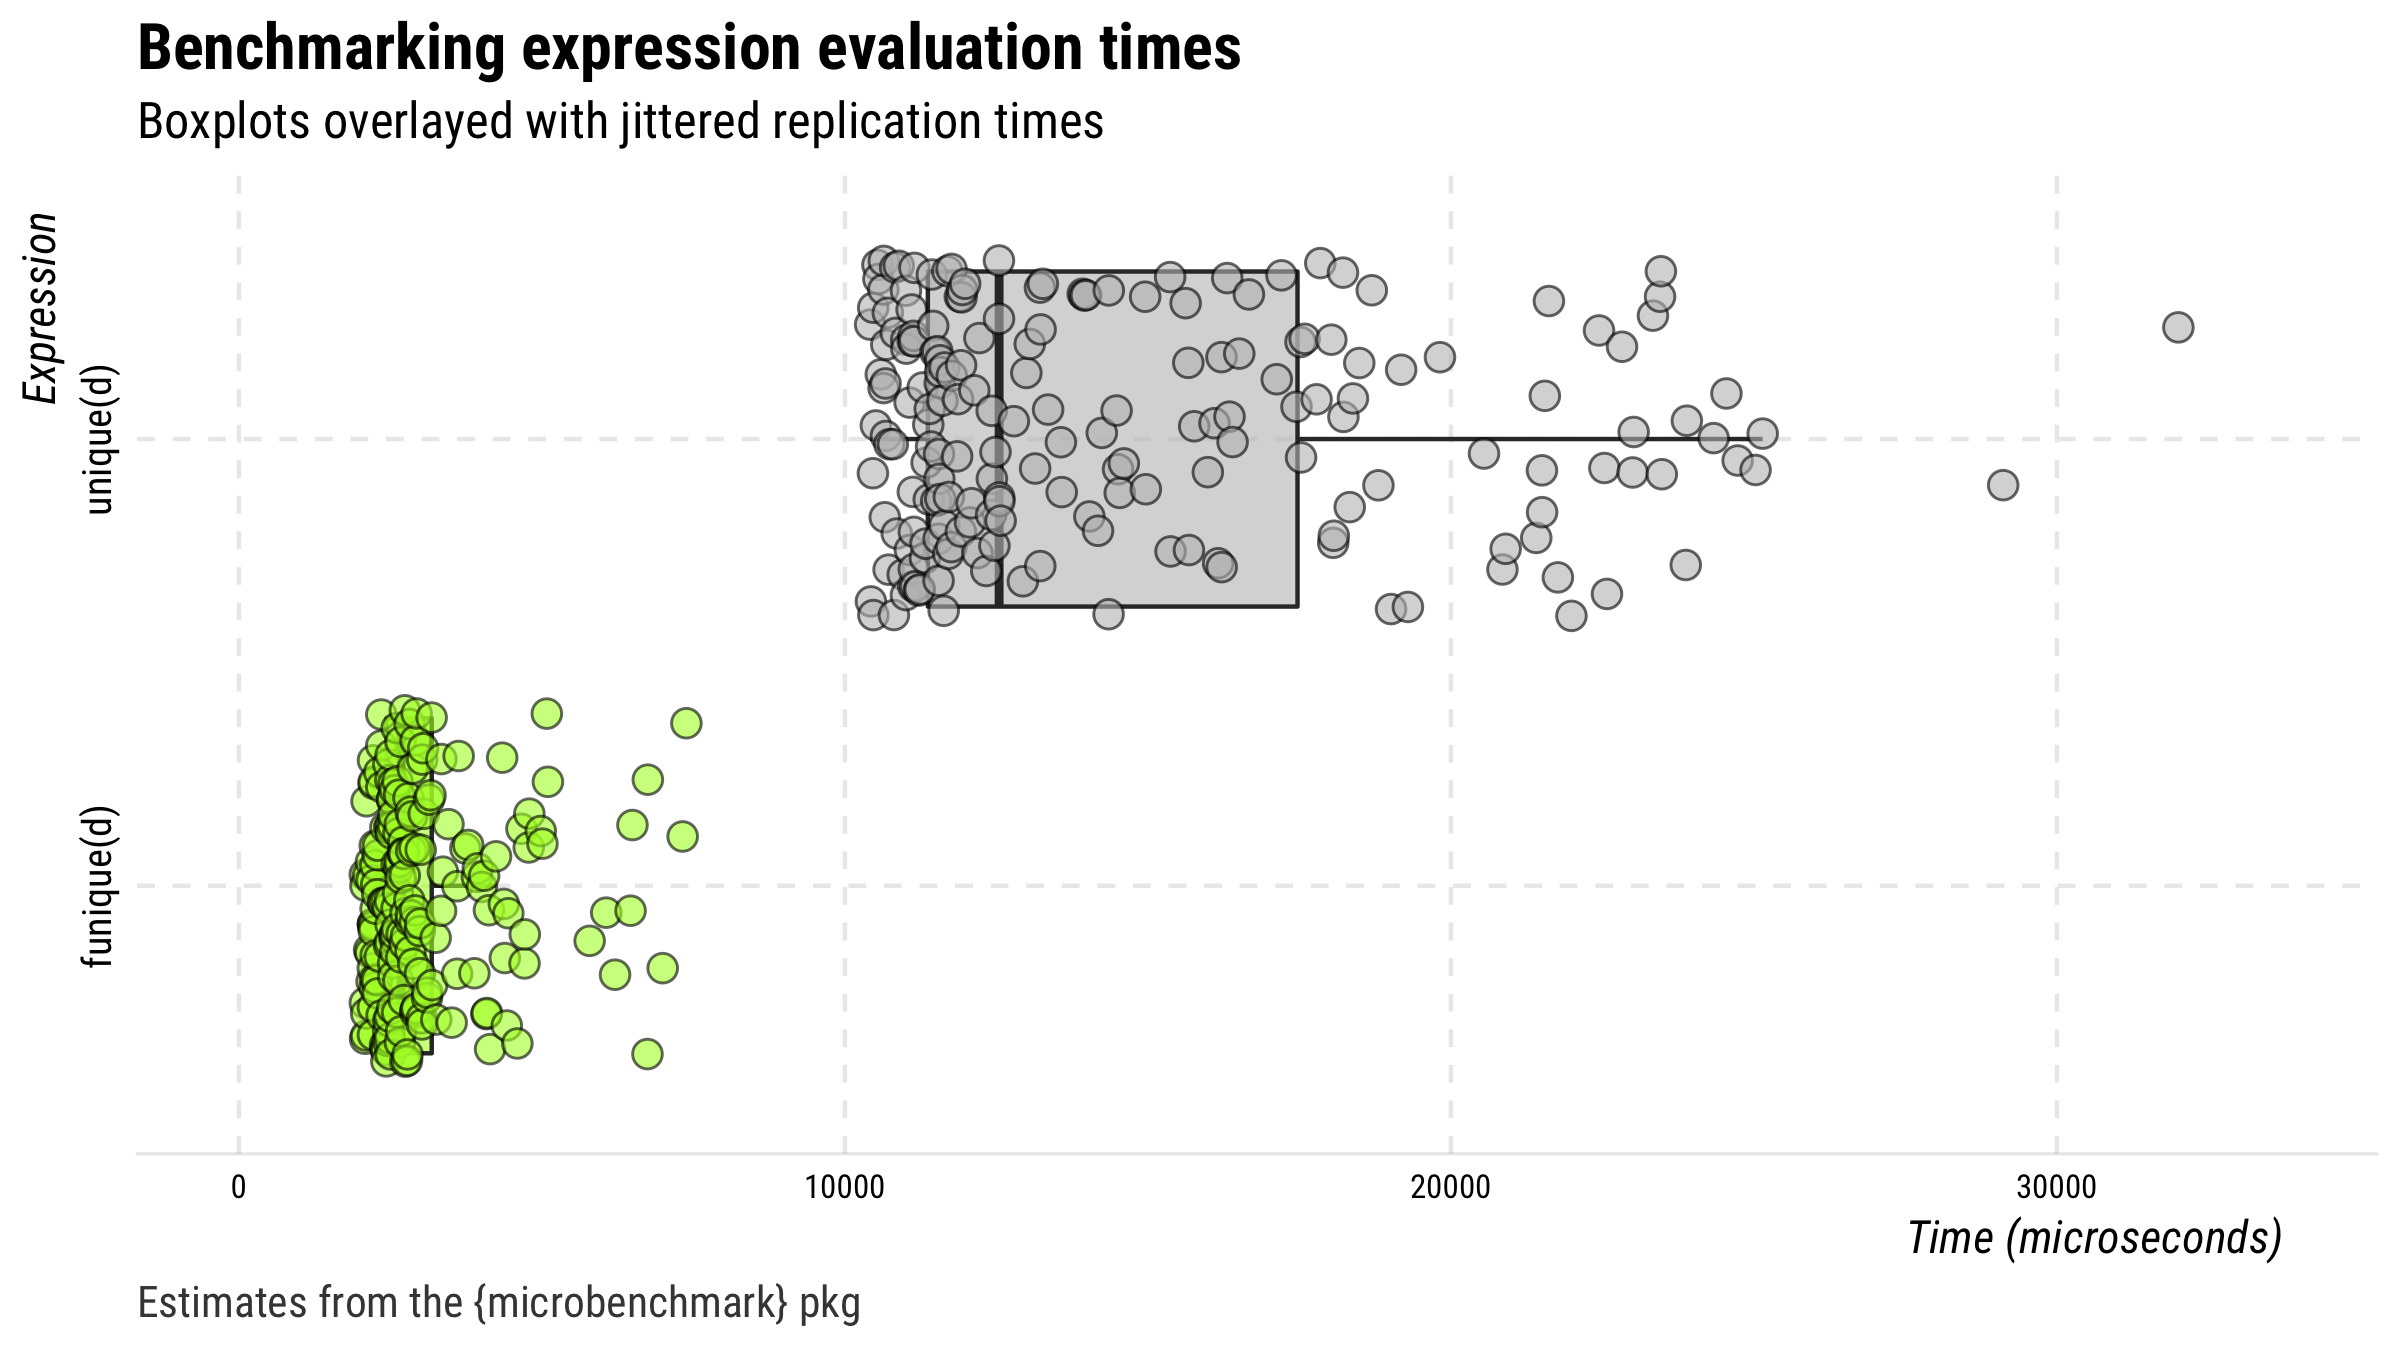
funique() vs. base::unique()The code below creates a data frame with several duplicate rows and
then compares performance (in time) of funique() versus
base::unique().
## set seed
set.seed(20180812)

## generate data
d <- data.frame(
  x = rnorm(1000),
  y = seq.POSIXt(as.POSIXct("2018-01-01"),
    as.POSIXct("2018-12-31"), length.out = 10))

## create data frame with duplicate rows
d <- d[c(1:1000, sample(1:1000, 500, replace = TRUE)), ]
row.names(d) <- NULL

## check the output against base::unique
identical(unique(d), funique(d))
#> [1] TRUE

## bench mark
(m <- microbenchmark::microbenchmark(unique(d), funique(d),
  times = 200, unit = "relative"))
#> Unit: relative
#>        expr     min      lq    mean  median      uq     max neval
#>   unique(d) 4.98663 4.92073 4.94704 5.14552 5.38573 2.02836   200
#>  funique(d) 1.00000 1.00000 1.00000 1.00000 1.00000 1.00000   200

## plot
plot(drop_hl(m, n = 4)) +
  ggplot2::ggsave("man/figures/r1.png", width = 8, height = 4.5, units = "in")
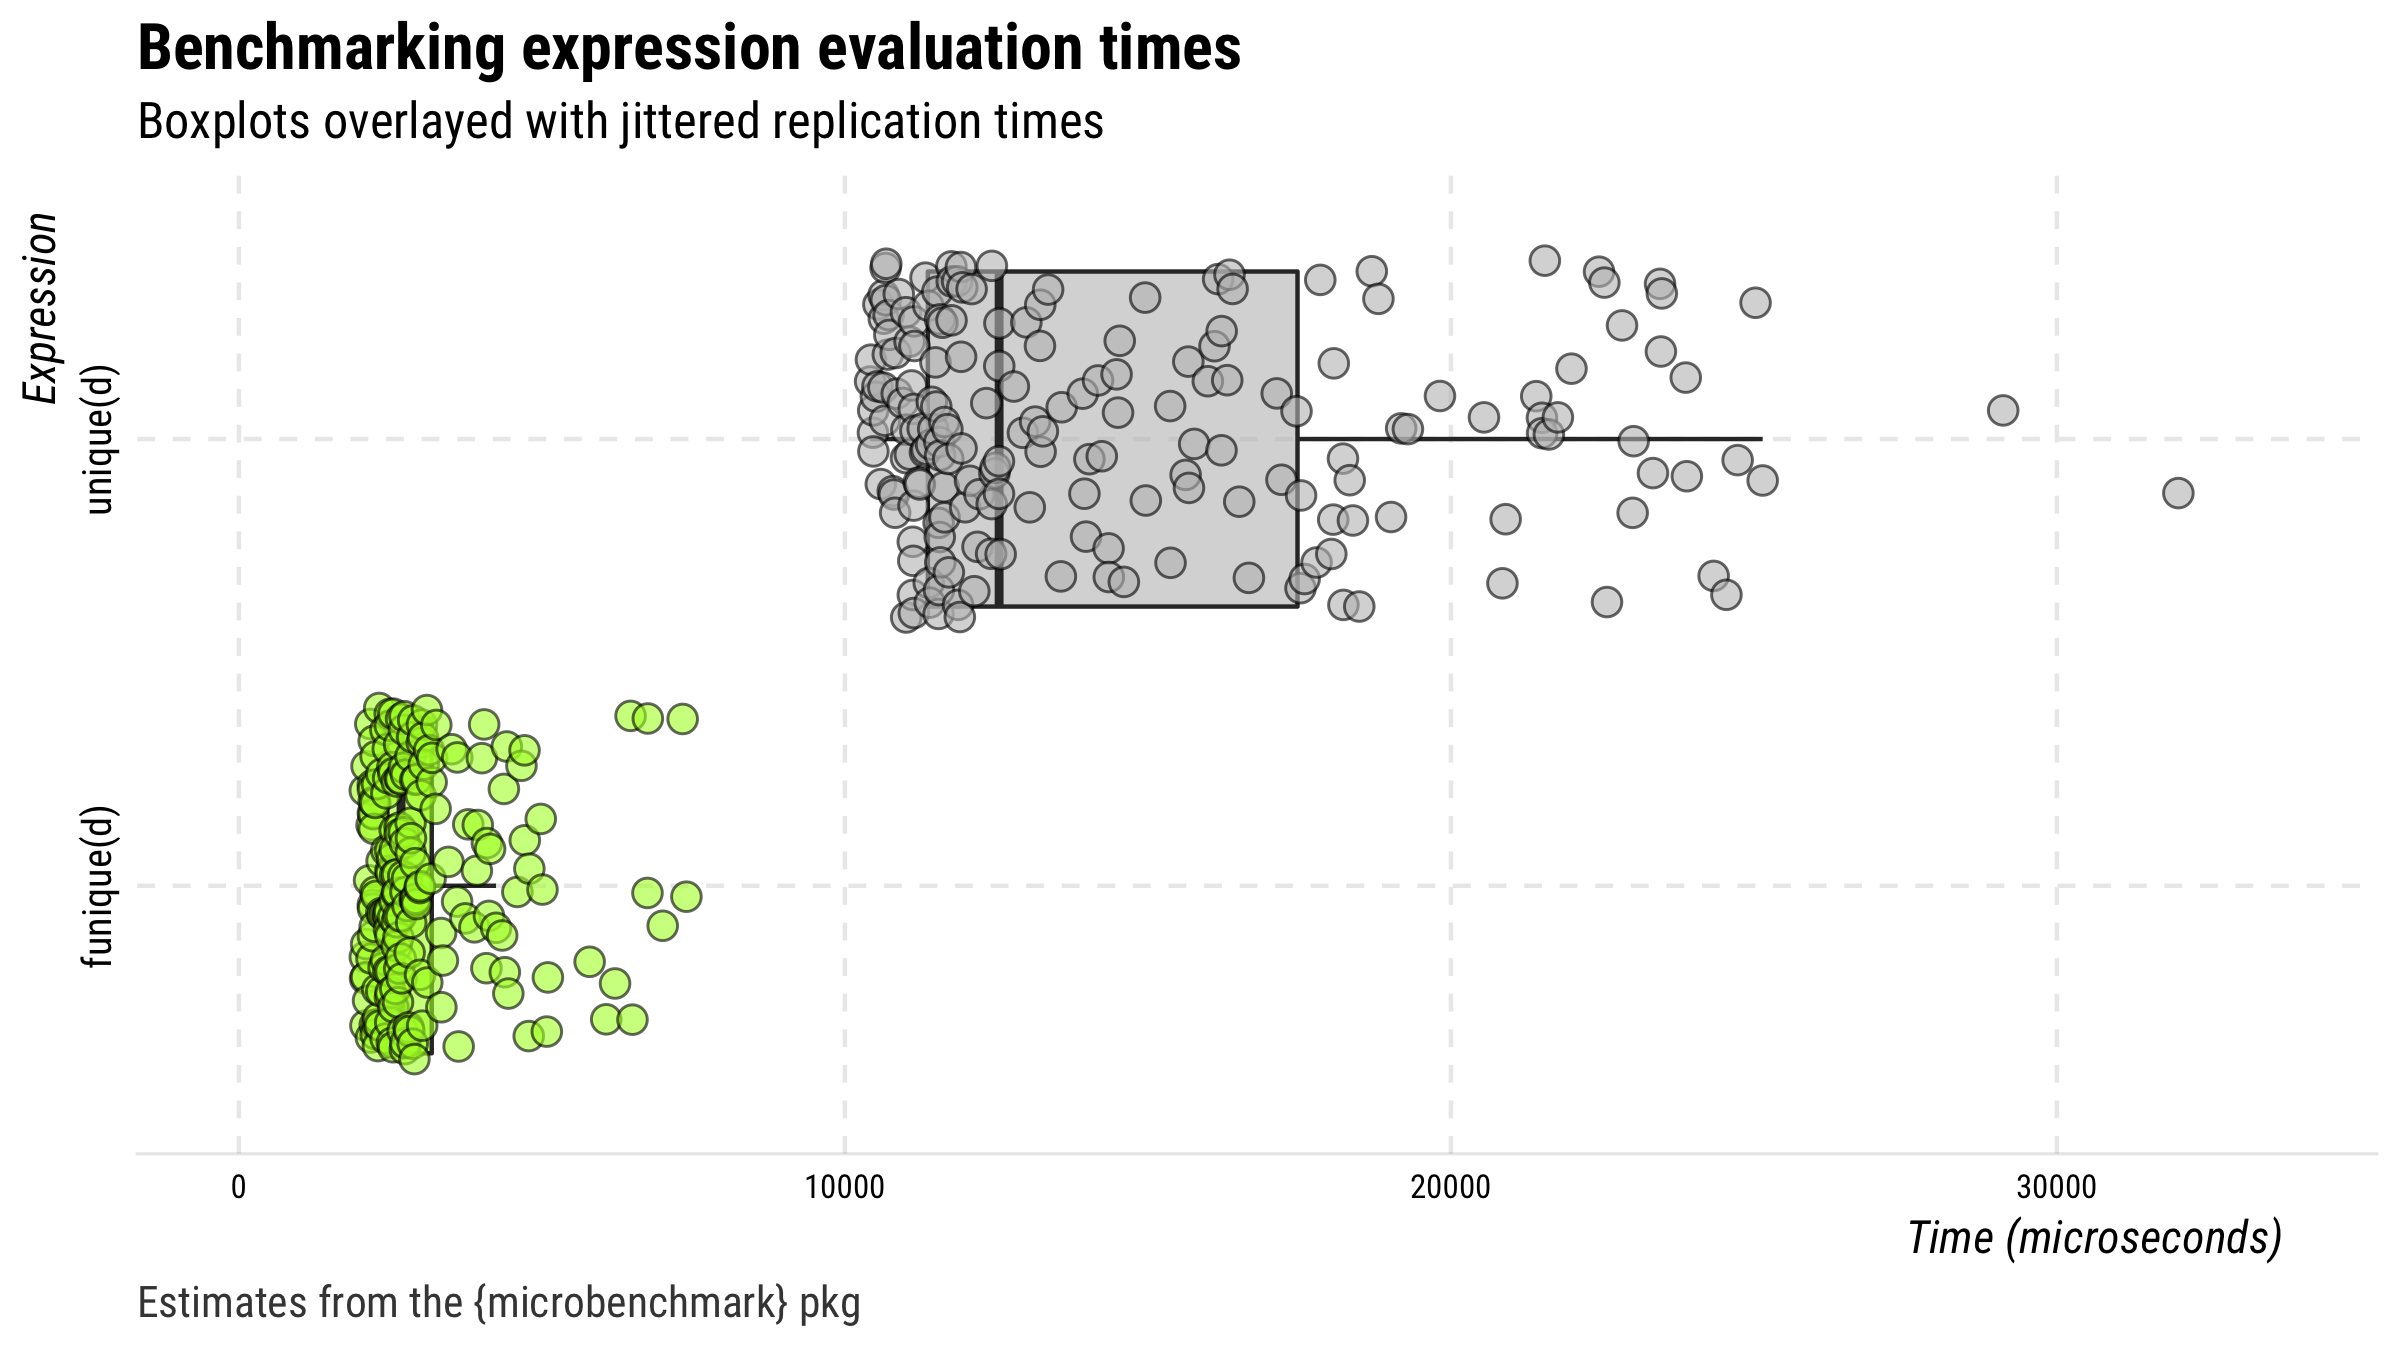
Here’s another test this time using duplicate-infested Twitter data.
## search for data on 100 tweets
rt <- rtweet::search_tweets("lang:en", verbose = FALSE)

## create duplicates
rt2 <- rt[sample(1:nrow(rt), 1000, replace = TRUE), ]

## benchmarks
(mb <- microbenchmark::microbenchmark(
  unique(rt2), funique(rt2), unit = "relative"))
#> Unit: relative
#>          expr     min      lq    mean median      uq      max neval
#>   unique(rt2) 1.56861 1.57622 1.35692 1.5524 1.35336 0.393617   100
#>  funique(rt2) 1.00000 1.00000 1.00000 1.0000 1.00000 1.000000   100

## make sure the output is the same
identical(unique(rt2), funique(rt2))
#> [1] TRUE

## plot
plot(drop_hl(m, n = 4)) +
  ggplot2::ggsave("man/figures/r2.png", width = 8, height = 4.5, units = "in")
These binaries (installable software) and packages are in development.
They may not be fully stable and should be used with caution. We make no claims about them.
Health stats visible at Monitor.