The hardware and bandwidth for this mirror is donated by dogado GmbH, the Webhosting and Full Service-Cloud Provider. Check out our Wordpress Tutorial.
If you wish to report a bug, or if you are interested in having us mirror your free-software or open-source project, please feel free to contact us at mirror[@]dogado.de.
![]()
The fude package provides utilities to facilitate the handling of the Fude Polygon data downloadable from the Ministry of Agriculture, Forestry and Fisheries (MAFF) website. The word “fude” is a Japanese counter suffix used to denote land parcels.
Fude Polygon data can now be downloaded from two different MAFF websites (both available only in Japanese):
GeoJSON format:
https://open.fude.maff.go.jp
FlatGeobuf format:
https://www.maff.go.jp/j/tokei/census/shuraku_data/2020/mb/
You can install the released version of fude from CRAN with:
install.packages("fude")Or the development version from GitHub with:
# install.packages("devtools")
devtools::install_github("takeshinishimura/fude")There are two ways to load Fude Polygon data, depending on how the data was obtained:
library(fude)
d <- read_fude("~/2022_38.zip")d2 <- read_fude(pref = "愛媛")ls_fude(d)
#> # A tibble: 20 × 7
#> name issue_year local_government_cd n pref_name city_name city_romaji
#> <chr> <int> <chr> <int> <chr> <chr> <chr>
#> 1 2022_38… 2022 382019 72045 愛媛県 松山市 Matsuyama-…
#> 2 2022_38… 2022 382027 43396 愛媛県 今治市 Imabari-shi
#> 3 2022_38… 2022 382035 61683 愛媛県 宇和島市 Uwajima-shi
#> 4 2022_38… 2022 382043 37753 愛媛県 八幡浜市 Yawatahama…
#> 5 2022_38… 2022 382051 15734 愛媛県 新居浜市 Niihama-shi
#> 6 2022_38… 2022 382060 63244 愛媛県 西条市 Saijo-shi
#> 7 2022_38… 2022 382078 37570 愛媛県 大洲市 Ozu-shi
#> 8 2022_38… 2022 382108 33302 愛媛県 伊予市 Iyo-shi
#> 9 2022_38… 2022 382132 34781 愛媛県 四国中央市…… Shikokuchu…
#> 10 2022_38… 2022 382141 73676 愛媛県 西予市 Seiyo-shi
#> 11 2022_38… 2022 382159 24235 愛媛県 東温市 Toon-shi
#> 12 2022_38… 2022 383562 2195 愛媛県 上島町 Kamijima-c…
#> 13 2022_38… 2022 383864 22823 愛媛県 久万高原町…… Kumakogen-…
#> 14 2022_38… 2022 384011 8634 愛媛県 松前町 Matsumae-c…
#> 15 2022_38… 2022 384020 7042 愛媛県 砥部町 Tobe-cho
#> 16 2022_38… 2022 384224 27131 愛媛県 内子町 Uchiko-cho
#> 17 2022_38… 2022 384429 23429 愛媛県 伊方町 Ikata-cho
#> 18 2022_38… 2022 384844 9089 愛媛県 松野町 Matsuno-cho
#> 19 2022_38… 2022 384887 16550 愛媛県 鬼北町 Kihoku-cho
#> 20 2022_38… 2022 385069 22931 愛媛県 愛南町 Ainan-choNote: This feature is available only for data obtained from GeoJSON (Obtaining Data #1).
Convert local government codes into Japanese municipality names for easier management.
dro <- rename_fude(d)
names(dro)
#>  [1] "2022_松山市"     "2022_今治市"     "2022_宇和島市"   "2022_八幡浜市"
#>  [5] "2022_新居浜市"   "2022_西条市"     "2022_大洲市"     "2022_伊予市"
#>  [9] "2022_四国中央市" "2022_西予市"     "2022_東温市"     "2022_上島町"
#> [13] "2022_久万高原町" "2022_松前町"     "2022_砥部町"     "2022_内子町"
#> [17] "2022_伊方町"     "2022_松野町"     "2022_鬼北町"     "2022_愛南町"
You can also rename the columns to Romaji instead of Japanese.
dro <- d |>
  rename_fude(suffix = TRUE, romaji = "title", quiet = FALSE)
#> 2022_382019 -> 2022_Matsuyama-shi
#> 2022_382027 -> 2022_Imabari-shi
#> 2022_382035 -> 2022_Uwajima-shi
#> 2022_382043 -> 2022_Yawatahama-shi
#> 2022_382051 -> 2022_Niihama-shi
#> 2022_382060 -> 2022_Saijo-shi
#> 2022_382078 -> 2022_Ozu-shi
#> 2022_382108 -> 2022_Iyo-shi
#> 2022_382132 -> 2022_Shikokuchuo-shi
#> 2022_382141 -> 2022_Seiyo-shi
#> 2022_382159 -> 2022_Toon-shi
#> 2022_383562 -> 2022_Kamijima-cho
#> 2022_383864 -> 2022_Kumakogen-cho
#> 2022_384011 -> 2022_Matsumae-cho
#> 2022_384020 -> 2022_Tobe-cho
#> 2022_384224 -> 2022_Uchiko-cho
#> 2022_384429 -> 2022_Ikata-cho
#> 2022_384844 -> 2022_Matsuno-cho
#> 2022_384887 -> 2022_Kihoku-cho
#> 2022_385069 -> 2022_Ainan-choDownload the agricultural community boundary data, which corresponds to the Fude Polygon data, from the MAFF website: https://www.maff.go.jp/j/tokei/census/shuraku_data/2020/ma/ (available only in Japanese).
b <- get_boundary(d)You can easily combine Fude Polygons with agricultural community boundaries to create enriched spatial analyses or maps.
library(ggplot2)

db <- combine_fude(d2, b, city = "松山市", rcom = "由良|北浦|鷲ケ巣|門田|馬磯|泊|御手洗|船越")

ggplot() +
  geom_sf(data = db$fude, aes(fill = rcom_name), alpha = .8) +
  guides(fill = guide_legend(reverse = TRUE, title = "興居島の集落別耕地")) +
  theme_void() +
  theme(legend.position = "bottom") +
theme(text = element_text(family = "Hiragino Sans"))![]()
出典:農林水産省「筆ポリゴンデータ(2025年度公開)」および「農業集落境界データ(2020年度)」を加工して作成。
Data enables extraction based on municipality names, former municipality names, and agricultural community names.
Note: This feature is available only for data obtained from FlatGeobuf (Obtaining Data #2).
extract_fude(d2, city = "松山市", kcity = "興居島")
#> Simple feature collection with 1691 features and 6 fields
#> Geometry type: MULTIPOLYGON
#> Dimension:     XY
#> Bounding box:  xmin: 132.6373 ymin: 33.87055 xmax: 132.6991 ymax: 33.92544
#> Geodetic CRS:  JGD2000
#> # A tibble: 1,691 × 7
#>    polygon_uuid                   land_type issue_year point_lng point_lat key
#>  * <chr>                              <dbl>      <dbl>     <dbl>     <dbl> <chr>
#>  1 5a72b4ef-b5f4-465e-9948-e9314…       200       2025      133.      33.9 3820…
#>  2 c69d86d5-1fb2-4528-a87b-155d8…       200       2025      133.      33.9 3820…
#>  3 627134ea-919c-4769-bd94-be16c…       200       2025      133.      33.9 3820…
#>  4 f2631019-d16e-42f9-8501-75f26…       200       2025      133.      33.9 3820…
#>  5 8fedb70d-4bb9-4447-879b-a0eea…       200       2025      133.      33.9 3820…
#>  6 cd235cdf-da51-4ead-ad50-efc6e…       200       2025      133.      33.9 3820…
#>  7 5853b7a1-62c3-4973-9e79-cabd3…       200       2025      133.      33.9 3820…
#>  8 5e090780-6d16-4b9e-aca9-c5622…       200       2025      133.      33.9 3820…
#>  9 90de4abf-e972-4031-987f-f3391…       200       2025      133.      33.9 3820…
#> 10 e5ade914-c803-42d1-9fa8-0921b…       200       2025      133.      33.9 3820…
#> # ℹ 1,681 more rows
#> # ℹ 1 more variable: geometry <MULTIPOLYGON [°]>You can explore Fude Polygon data interactively.
library(shiny)

s <- shiny_fude(db, rcom = TRUE)
# shinyApp(ui = s$ui, server = s$server)You can read data from the MAFF database (地域の農業を見て・知って・活かすDB).
library(dplyr)

b1 <- get_boundary(d2, path = "~", boundary_type = 1, quiet = TRUE)
b2 <- get_boundary(d2, path = "~", boundary_type = 2, quiet = TRUE)
b3 <- get_boundary(d2, path = "~", boundary_type = 3, quiet = TRUE)

m1 <- b1 |>
  read_ikasudb("~/IA0001_2023_2020_38.xlsx") |>
  read_ikasudb("~/SA1009_2020_2020_38.xlsx") |>
  read_ikasudb("~/GC0001_2019_2020_38.xlsx") |>
  mutate(
    地域類型1次分類 = factor(地域類型1次分類, labels = c("都市的地域", "平地農業地域", "中間農業地域", "山間農業地域"))
  )

ggplot() +
  geom_sf(data = m1, aes(fill = 地域類型1次分類), alpha = .8) +
  theme_void() +
  theme(text = element_text(family = "Hiragino Sans"))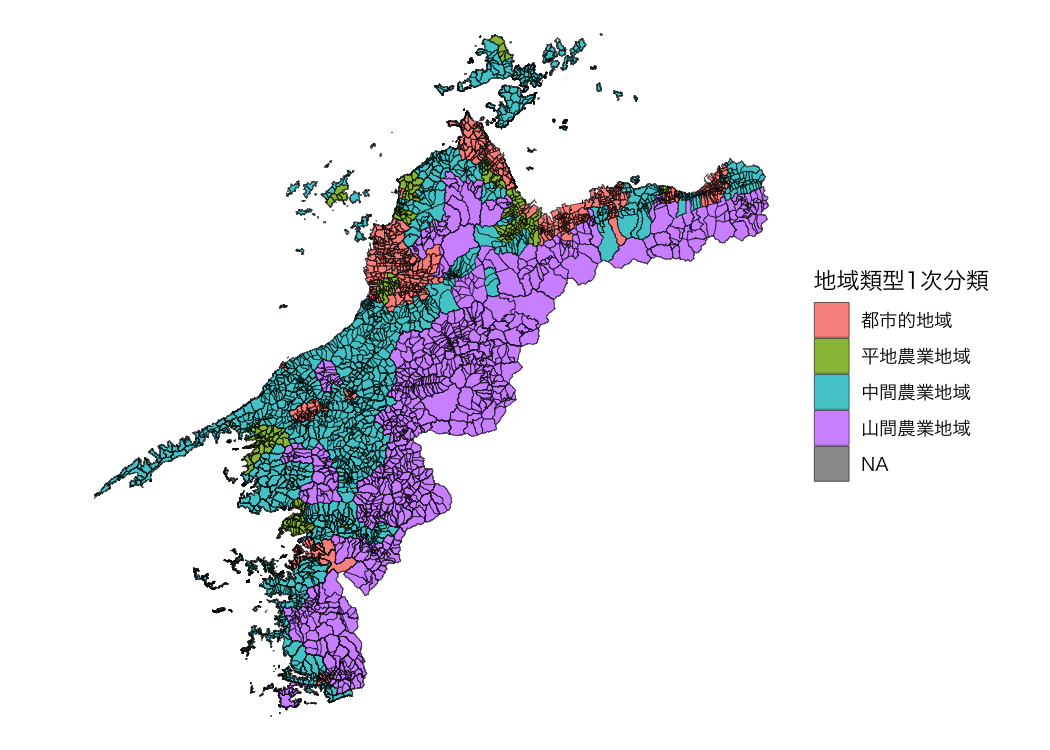
資料:農林水産省「農業集落境界データ(2020年度)」を加工して作成。
mapview
packageIf you want to use mapview(), do the following.
db1 <- combine_fude(d, b, city = "伊方町")
db2 <- combine_fude(d, b, city = "八幡浜市")
db3 <- combine_fude(d, b, city = "西予市", kcity = "三瓶|二木生|三島|双岩")

db <- bind_fude(db1, db2, db3)
db$fude <- sf::st_transform(db$fude, crs = 3857)

library(mapview)

mapview(db$fude, zcol = "rcom_name", layer.name = "農業集落名")
These binaries (installable software) and packages are in development.
They may not be fully stable and should be used with caution. We make no claims about them.
Health stats visible at Monitor.