The hardware and bandwidth for this mirror is donated by dogado GmbH, the Webhosting and Full Service-Cloud Provider. Check out our Wordpress Tutorial.
If you wish to report a bug, or if you are interested in having us mirror your free-software or open-source project, please feel free to contact us at mirror[@]dogado.de.
![]()
![]()
R uses factors to handle categorical variables, variables that have a fixed and known set of possible values. Factors are also helpful for reordering character vectors to improve display. The goal of the forcats package is to provide a suite of tools that solve common problems with factors, including changing the order of levels or the values. Some examples include:
fct_reorder(): Reordering a factor by another
variable.fct_infreq(): Reordering a factor by the frequency of
values.fct_relevel(): Changing the order of a factor by
hand.fct_lump(): Collapsing the least/most frequent values
of a factor into “other”.You can learn more about each of these in
vignette("forcats"). If you’re new to factors, the best
place to start is the chapter on factors in R
for Data Science.
# The easiest way to get forcats is to install the whole tidyverse:
install.packages("tidyverse")

# Alternatively, install just forcats:
install.packages("forcats")

# Or the the development version from GitHub:
# install.packages("pak")
pak::pak("tidyverse/forcats")
forcats is part of the core tidyverse, so you can load it with
library(tidyverse) or library(forcats).
library(forcats)
library(dplyr)
library(ggplot2)
starwars |>
filter(!is.na(species)) |>
count(species, sort = TRUE)
#> # A tibble: 37 × 2
#> species n
#> <chr> <int>
#> 1 Human 35
#> 2 Droid 6
#> 3 Gungan 3
#> 4 Kaminoan 2
#> 5 Mirialan 2
#> 6 Twi'lek 2
#> 7 Wookiee 2
#> 8 Zabrak 2
#> 9 Aleena 1
#> 10 Besalisk 1
#> # ℹ 27 more rowsstarwars |>
filter(!is.na(species)) |>
mutate(species = fct_lump(species, n = 3)) |>
count(species)
#> # A tibble: 4 × 2
#> species n
#> <fct> <int>
#> 1 Droid 6
#> 2 Gungan 3
#> 3 Human 35
#> 4 Other 39ggplot(starwars, aes(x = eye_color)) +
geom_bar() +
coord_flip()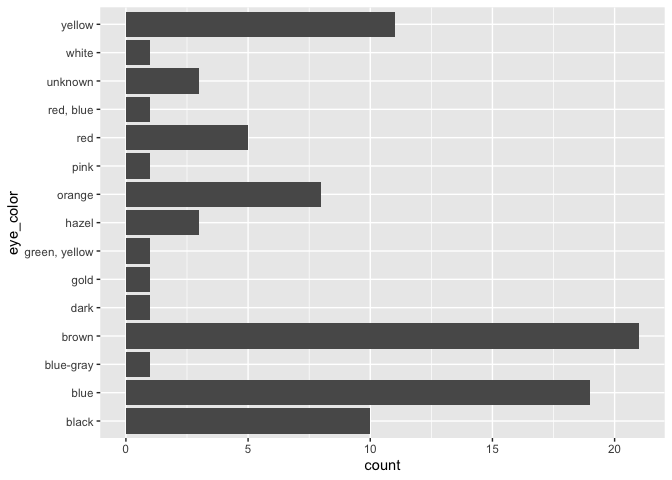
starwars |>
  mutate(eye_color = fct_infreq(eye_color)) |>
  ggplot(aes(x = eye_color)) +
  geom_bar() +
  coord_flip()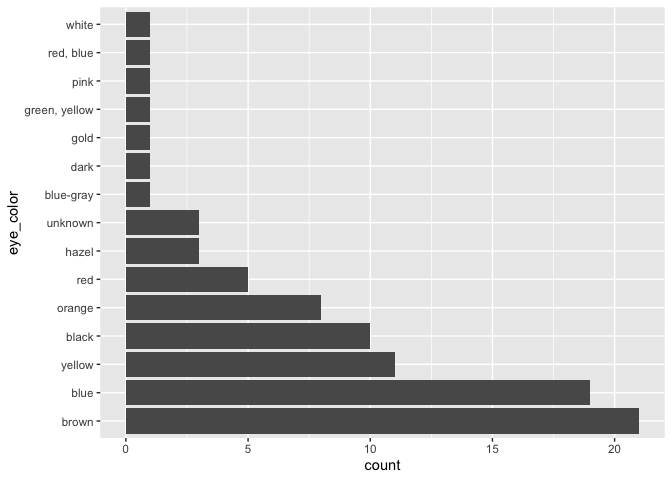
For a history of factors, I recommend stringsAsFactors: An unauthorized biography by Roger Peng and stringsAsFactors = <sigh> by Thomas Lumley. If you want to learn more about other approaches to working with factors and categorical data, I recommend Wrangling categorical data in R, by Amelia McNamara and Nicholas Horton.
If you encounter a clear bug, please file a minimal reproducible example on Github. For questions and other discussion, please use https://forum.posit.co/.
These binaries (installable software) and packages are in development.
They may not be fully stable and should be used with caution. We make no claims about them.
Health stats visible at Monitor.