The hardware and bandwidth for this mirror is donated by dogado GmbH, the Webhosting and Full Service-Cloud Provider. Check out our Wordpress Tutorial.
If you wish to report a bug, or if you are interested in having us mirror your free-software or open-source project, please feel free to contact us at mirror[@]dogado.de.
The goal of finnishgrid is to provide an easy one-liner access to all Fingrid Open Data API functions.
You can install the development version of finnishgrid from GitHub with:
# install.packages("devtools")
# required dependencies httr and jsonlite
# install.packages(c("httr", "jsonlite"))
devtools::install_github("virmar/finnishgrid")Read basic API specification at https://data.fingrid.fi/en/instructions and register free user account.
Optional: add API key as your environment variable (~/.Renviron)
FINGRID_OPENDATA_API_KEY=MY_SECRET_KEY_FROM_API_PAGESLet’s get Finnish hourly electricity consumption and production time-series data for basic visualization.
library(finnishgrid)
start_time_utc = "2024-06-01T00:00:00.000Z"
end_time_utc = "2024-06-03T00:00:00.000Z"
user_key = NA # TODO: replace with right key or use .Renviron fileelec_cons <- powersys_electricity_consumption_FI_RTD(start_time_utc = start_time_utc,
end_time_utc = end_time_utc,
user_key = user_key)
Sys.sleep(1)
elec_prod <- powersys_electricity_production_FI_RTD(start_time_utc = start_time_utc,
end_time_utc = end_time_utc,
user_key = user_key)
Sys.sleep(1)
min_elec_cons <- min(elec_cons$value) # consumption
max_elec_cons <- max(elec_cons$value)
min_elec_prod <- min(elec_prod$value) # production
max_elec_prod <- max(elec_prod$value)
y_max <- max(max_elec_cons, max_elec_prod)
y_min <- min(min_elec_cons, min_elec_prod)plot(elec_cons$start_time, elec_cons$value, type = 'l',
col = "green", ylim = c(y_min, y_max),
ylab = "Produced/Consumed (MW)",
xlab = "Time", main = "Electricity",
sub = "Data source Fingrid / data.fingrid.fi, license CC 4.0 BY")
lines(elec_prod$start_time, elec_prod$value, type = 'l', col = "blue")
legend("topright", c("Cons", "Prod"), fill = c("green", "blue"))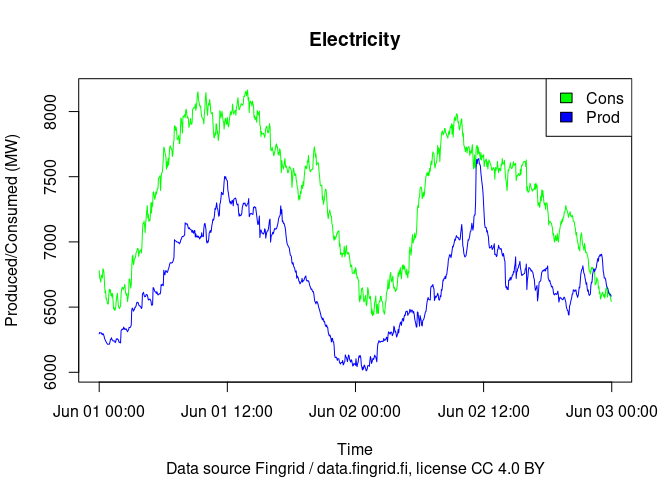
API page: https://data.fingrid.fi/en/datasets/124
tmp <- get_data(api_number = 193,  # energy consumption
                start_time = start_time_utc,
                end_time = end_time_utc,
                user_key = NA)
summary(tmp)
#>  start_time_utc                 end_time_utc                     value
#>  Min.   :2024-06-01 00:00:00   Min.   :2024-06-01 00:03:00   Min.   :6434
#>  1st Qu.:2024-06-01 11:59:15   1st Qu.:2024-06-01 12:02:15   1st Qu.:6914
#>  Median :2024-06-01 23:58:30   Median :2024-06-02 00:01:30   Median :7441
#>  Mean   :2024-06-01 23:58:30   Mean   :2024-06-02 00:01:30   Mean   :7347
#>  3rd Qu.:2024-06-02 11:57:45   3rd Qu.:2024-06-02 12:00:45   3rd Qu.:7726
#>  Max.   :2024-06-02 23:57:00   Max.   :2024-06-03 00:00:00   Max.   :8166
#>        id
#>  Min.   :193
#>  1st Qu.:193
#>  Median :193
#>  Mean   :193
#>  3rd Qu.:193
#>  Max.   :193
These binaries (installable software) and packages are in development.
They may not be fully stable and should be used with caution. We make no claims about them.
Health stats visible at Monitor.