The hardware and bandwidth for this mirror is donated by dogado GmbH, the Webhosting and Full Service-Cloud Provider. Check out our Wordpress Tutorial.
If you wish to report a bug, or if you are interested in having us mirror your free-software or open-source project, please feel free to contact us at mirror[@]dogado.de.
![]()
![]()
cytofan implements the concept of fan plots (Britton,
E.; Fisher, P. & J. Whitley (1998) The Inflation Report Projections:
Understanding the Fan Chart) for cytometry data in ggplot2.
The cytofan package was implemented following up on a gist
written shortly after the fanplot package
was released. Compared to ggfan,
cytofan uses categorical data as input on the x axis.
You can install cytofan from github with:
# install.packages("devtools")
devtools::install_github("yannabraham/cytofan")cytofan can be used to visualize differences between
populations identifed using mass cytometry:
library(cytofan)
#> Loading required package: ggplot2
library(bodenmiller)
library(dplyr)
#>
#> Attaching package: 'dplyr'
#> The following objects are masked from 'package:stats':
#>
#>     filter, lag
#> The following objects are masked from 'package:base':
#>
#>     intersect, setdiff, setequal, union
library(tidyr)

data("refPhenoMat")
data("refAnnots")

bind_cols(refAnnots,
          as.data.frame(refPhenoMat)) %>%
  filter(Cells %in% c('cd4+','cd8+','igm+','igm-')) %>%
  gather("Channel","value",
         any_of(colnames(refPhenoMat))) %>%
  ggplot(aes(x=Channel,y=value))+
  geom_fan()+
  facet_grid(Cells~.)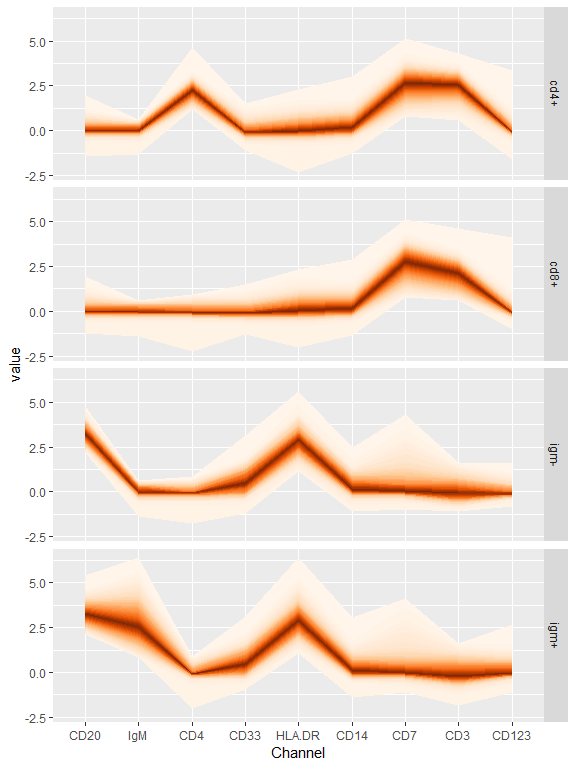
These binaries (installable software) and packages are in development.
They may not be fully stable and should be used with caution. We make no claims about them.
Health stats visible at Monitor.