The hardware and bandwidth for this mirror is donated by dogado GmbH, the Webhosting and Full Service-Cloud Provider. Check out our Wordpress Tutorial.
If you wish to report a bug, or if you are interested in having us mirror your free-software or open-source project, please feel free to contact us at mirror[@]dogado.de.
![]()
![]()
The cdom package implements various functions used to model and calculate metrics from absorption spectra of chromophotic dissolved organic matter (CDOM).
This package provides:
The package can be installed using the following command.
devtools::install_github("PMassicotte/cdom")Please note that this is a developing version of the package for testing only. Please fill an issue when you find bugs.
All functions from the package start with the cdom_
prefix.
library(cdom)
ls("package:cdom")
## [1] "cdom_exponential"    "cdom_slope_ratio"    "cdom_spectral_curve"
## [4] "spectra"The cdom_fit_exponential() function fits an exponential
curve to CDOM data using the simple model proposed by Jerlov (1968),
Lundgren (1976), Bricaud, Morel, and Prieur (1981).
a(\lambda) = a(\lambda0)e^{-S(\lambda - \lambda0)} + Klibrary(ggplot2)
library(cdom)
data(spectra)
fit <- cdom_exponential(
wl = spectra$wavelength,
absorbance = spectra$spc3,
wl0 = 350,
startwl = 190,
endwl = 900
)
coef(fit)
## S K a0
## 0.02220677 1.85125088 6.02460462
p <- plot(fit)
## Warning: `aes_string()` was deprecated in ggplot2 3.0.0.
## ℹ Please use tidy evaluation idioms with `aes()`.
## ℹ See also `vignette("ggplot2-in-packages")` for more information.
## ℹ The deprecated feature was likely used in the cdom package.
## Please report the issue at <https://github.com/PMassicotte/cdom/issues>.
## This warning is displayed once per session.
## Call `lifecycle::last_lifecycle_warnings()` to see where this warning was
## generated.
p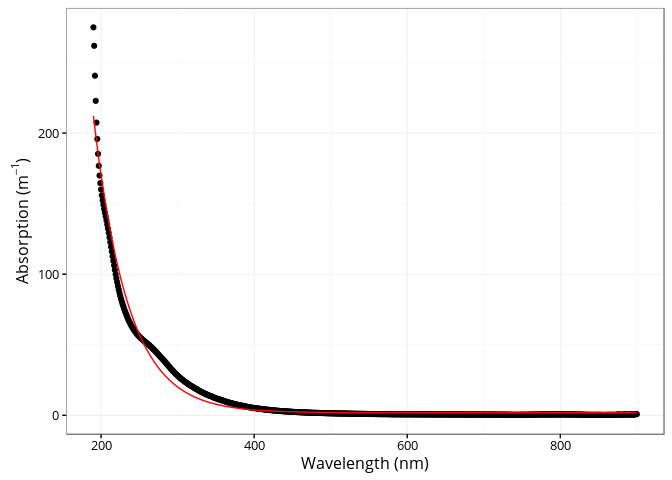
The cdom_slope_ratio() function calculates the slope
ratio (SR) which is defined as:
S275-295/S350-400. See Helms et al. (2008) for
detailed information.
library(cdom)
data(spectra)
cdom_slope_ratio(spectra$wavelength, spectra$spc1)
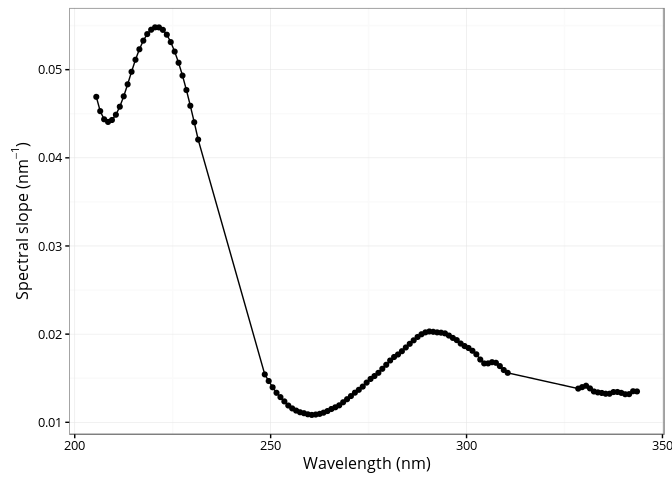
## [1] 1.325082The cdom_spectral_curve() function generates the
spectral curve using the slope of the linear regression between the
natural log absorption spectrum and wavelengths over a sliding window of
21 nm interval (default) at 1 nm resolution. See Loiselle et al. (2009)
for detailed information.
library(cdom)
data(spectra)

res <- cdom_spectral_curve(
  wl = spectra$wavelength,
  absorbance = spectra$spc10,
  interval = 21,
  r2threshold = 0.98
) # Maybe to restrictive...

ggplot(res, aes(x = wl, y = s)) +
  geom_point() +
  geom_line() +
  xlab("Wavelength (nm)") +
  ylab(expression(paste(
    "Spectral slope (",
    nm^{
      -1
    },
    ")"
  )))
library(dplyr)
##
## Attaching package: 'dplyr'
## The following objects are masked from 'package:stats':
##
##     filter, lag
## The following objects are masked from 'package:base':
##
##     intersect, setdiff, setequal, union
library(tidyr)

data(spectra)

spectra_nested <- spectra %>%
  pivot_longer(
    starts_with("spc"),
    names_to = "sample",
    values_to = "absorption"
  ) %>%
  group_by(sample) %>%
  nest() %>%
  mutate(
    model = purrr::map(
      data,
      ~ cdom_exponential(
        .$wavelength,
        .$absorption,
        wl0 = 350,
        startwl = 190,
        endwl = 900
      )
    )
)A total 25 absorption spectra are provided in the package.
library(ggplot2)
library(tidyr)
data(spectra)

spectra <- pivot_longer(
  spectra,
  starts_with("spc"),
  names_to = "sample",
  values_to = "absorption"
)

ggplot(spectra, aes(x = wavelength, y = absorption, group = sample)) +
  geom_line(size = 0.1) +
  xlab("Wavelength (nm)") +
  ylab(expression(paste(
    "Absorption (",
    m^{
      -1
    },
    ")"
  )))
## Warning: Using `size` aesthetic for lines was deprecated in ggplot2 3.4.0.
## ℹ Please use `linewidth` instead.
## This warning is displayed once per session.
## Call `lifecycle::last_lifecycle_warnings()` to see where this warning was
## generated.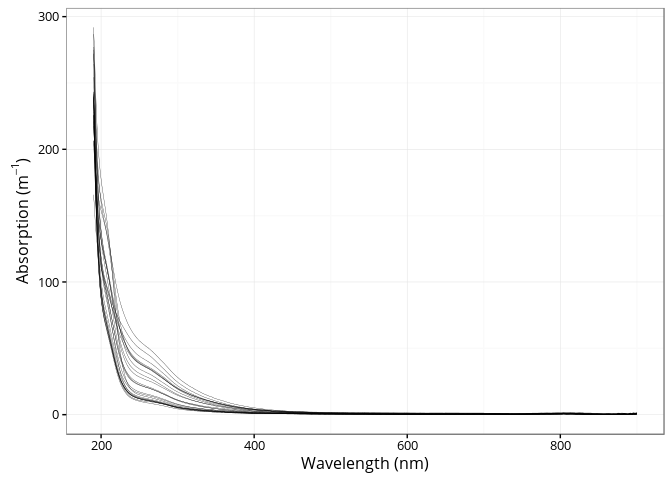
citation("cdom")
## To cite cdom in publications use:
##
##   Massicotte, P., and Markager, S. (2016). Using a Gaussian
##   decomposition approach to model absorption spectra of chromophoric
##   dissolved organic matter. Mar. Chem. 180, 24-32.
##   doi:10.1016/j.marchem.2016.01.008.
##
## A BibTeX entry for LaTeX users is
##
##   @Article{,
##     title = {Using a Gaussian decomposition approach to model absorption spectra of chromophoric dissolved organic matter},
##     author = {Philippe Massicotte and Stiig Markager},
##     journal = {Marine Chemistry},
##     year = {2016},
##     volume = {180},
##     pages = {24--32},
##     url = {https://linkinghub.elsevier.com/retrieve/pii/S0304420316300081},
## }These binaries (installable software) and packages are in development.
They may not be fully stable and should be used with caution. We make no claims about them.
Health stats visible at Monitor.