The hardware and bandwidth for this mirror is donated by dogado GmbH, the Webhosting and Full Service-Cloud Provider. Check out our Wordpress Tutorial.
If you wish to report a bug, or if you are interested in having us mirror your free-software or open-source project, please feel free to contact us at mirror[@]dogado.de.
![]()
{batsch} provides real-time PCR data sets by Batsch et al. (2008) in tidy format. There are five data sets bundled with this package, one for each PCR target:
SLC6A14r for rat SLC6A14SLC22A13h for human SLC22A13EMTp for pig EMTETTch for chicken ETTGAPDHh for human GAPDHEach data set comprises a five-point, four-fold dilution series. For each concentration there are three replicates. Each amplification curve is 45 cycles long.
Install {batsch} from CRAN:
You can instead install the development version of {batsch} from GitHub:
library(batsch)

SLC6A14r |>
  ggplot(mapping = aes(
    x = cycle,
    y = fluor,
    group = interaction(dilution, replicate),
    col = as.factor(dilution)
  )) +
  geom_line(linewidth = 0.5) +
  labs(y = "Raw fluorescence", colour = "Dilution factor", title = "Rat SLC6A14") +
  guides(color = guide_legend(override.aes = list(size = 0.5)))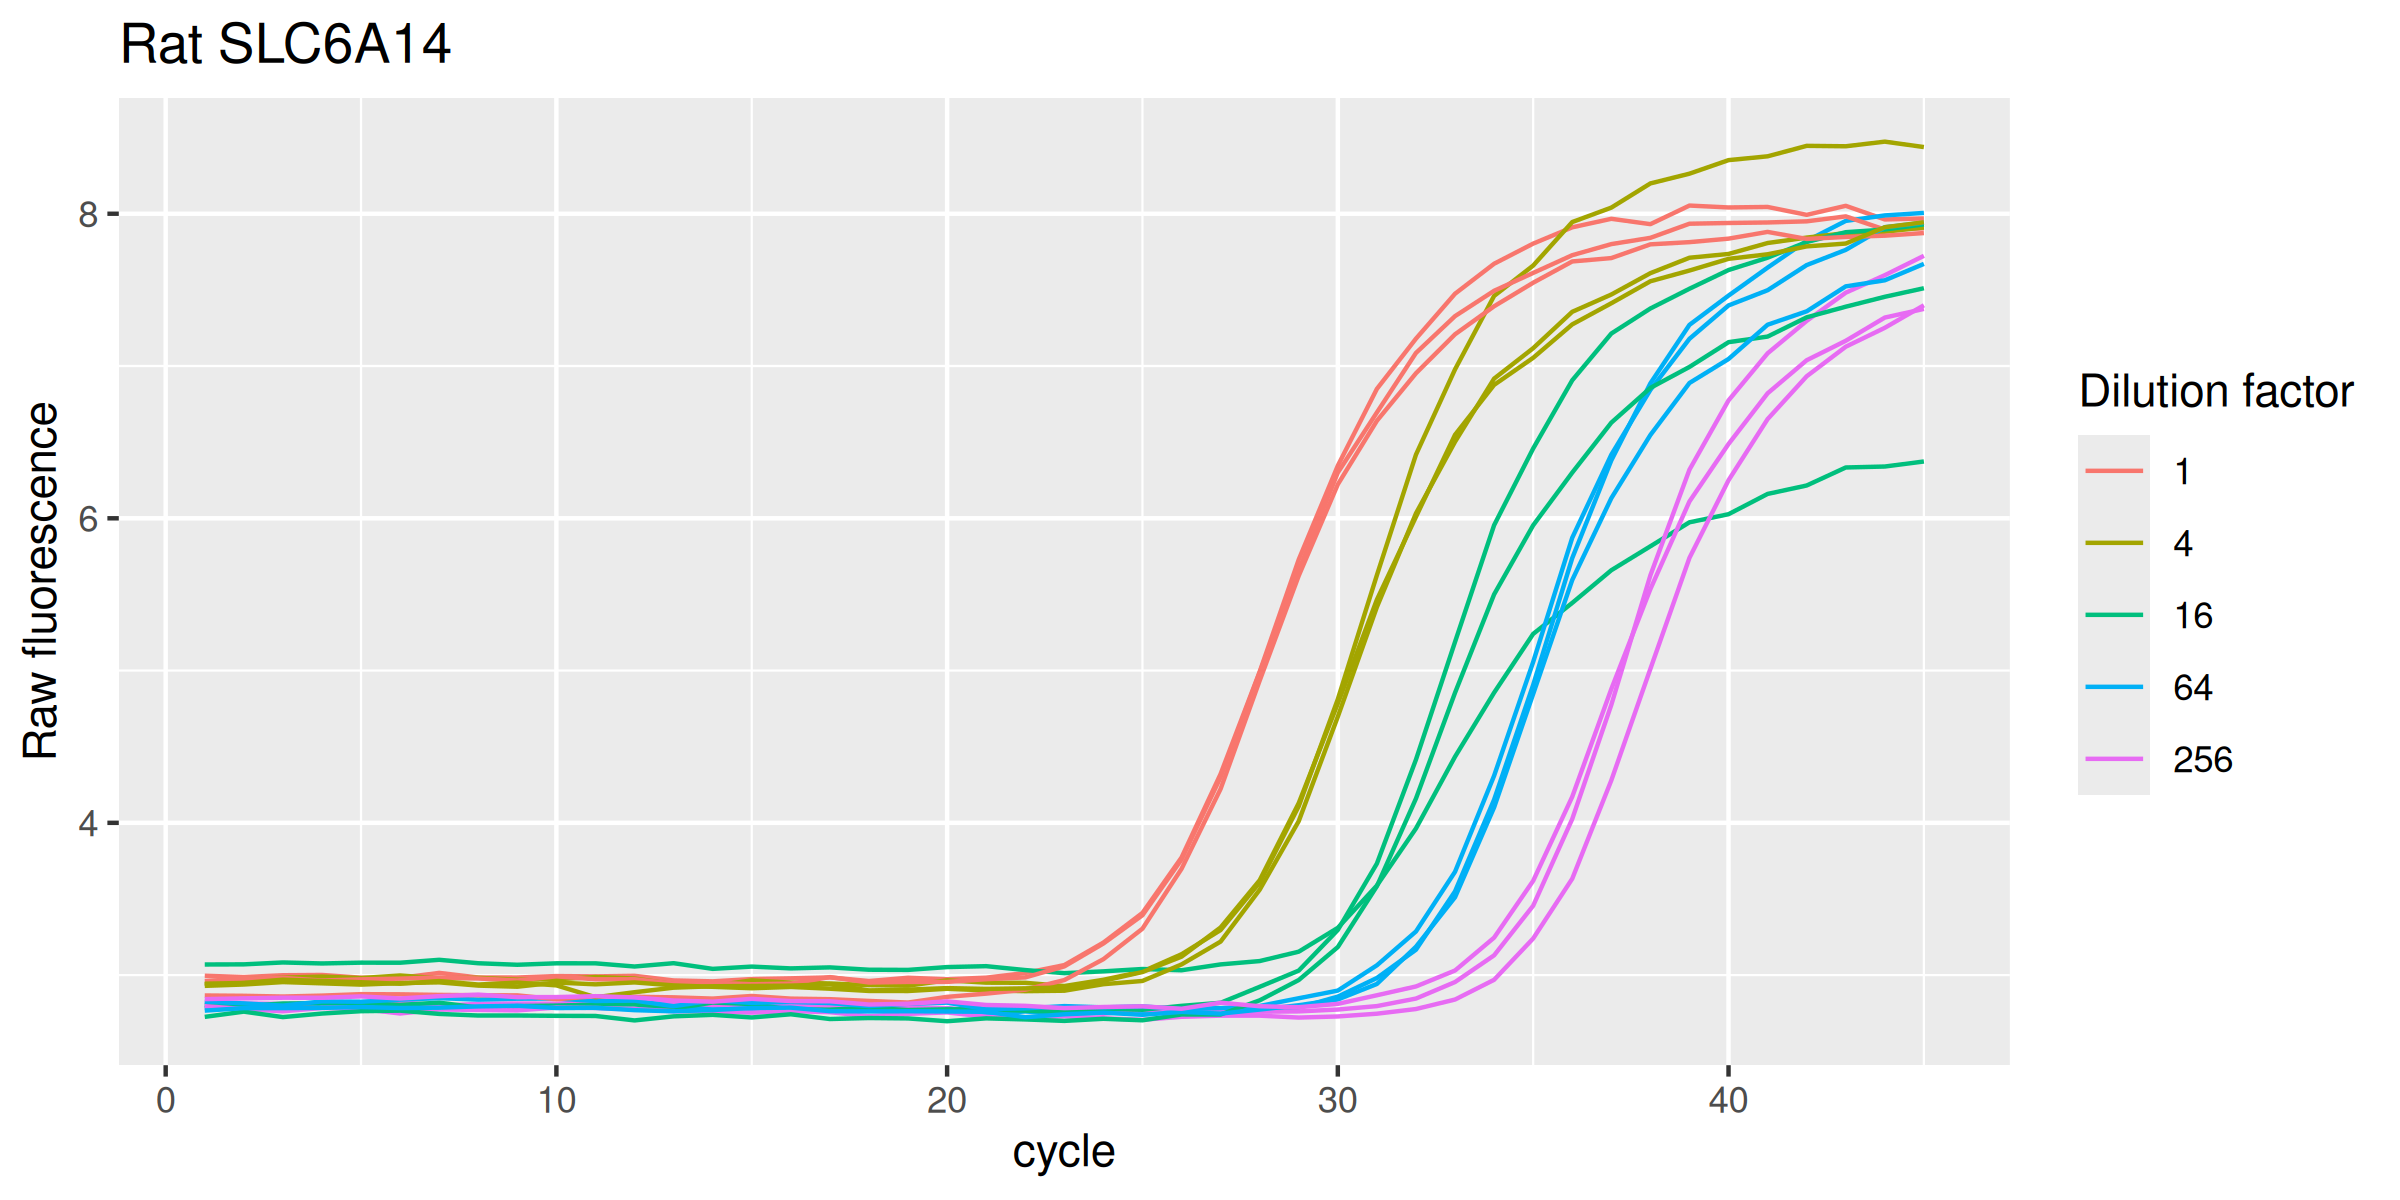
SLC22A13h |>
  ggplot(mapping = aes(
    x = cycle,
    y = fluor,
    group = interaction(dilution, replicate),
    col = as.factor(dilution)
  )) +
  geom_line(linewidth = 0.5) +
  labs(y = "Raw fluorescence", colour = "Dilution factor", title = "Human SLC22A13") +
  guides(color = guide_legend(override.aes = list(size = 0.5)))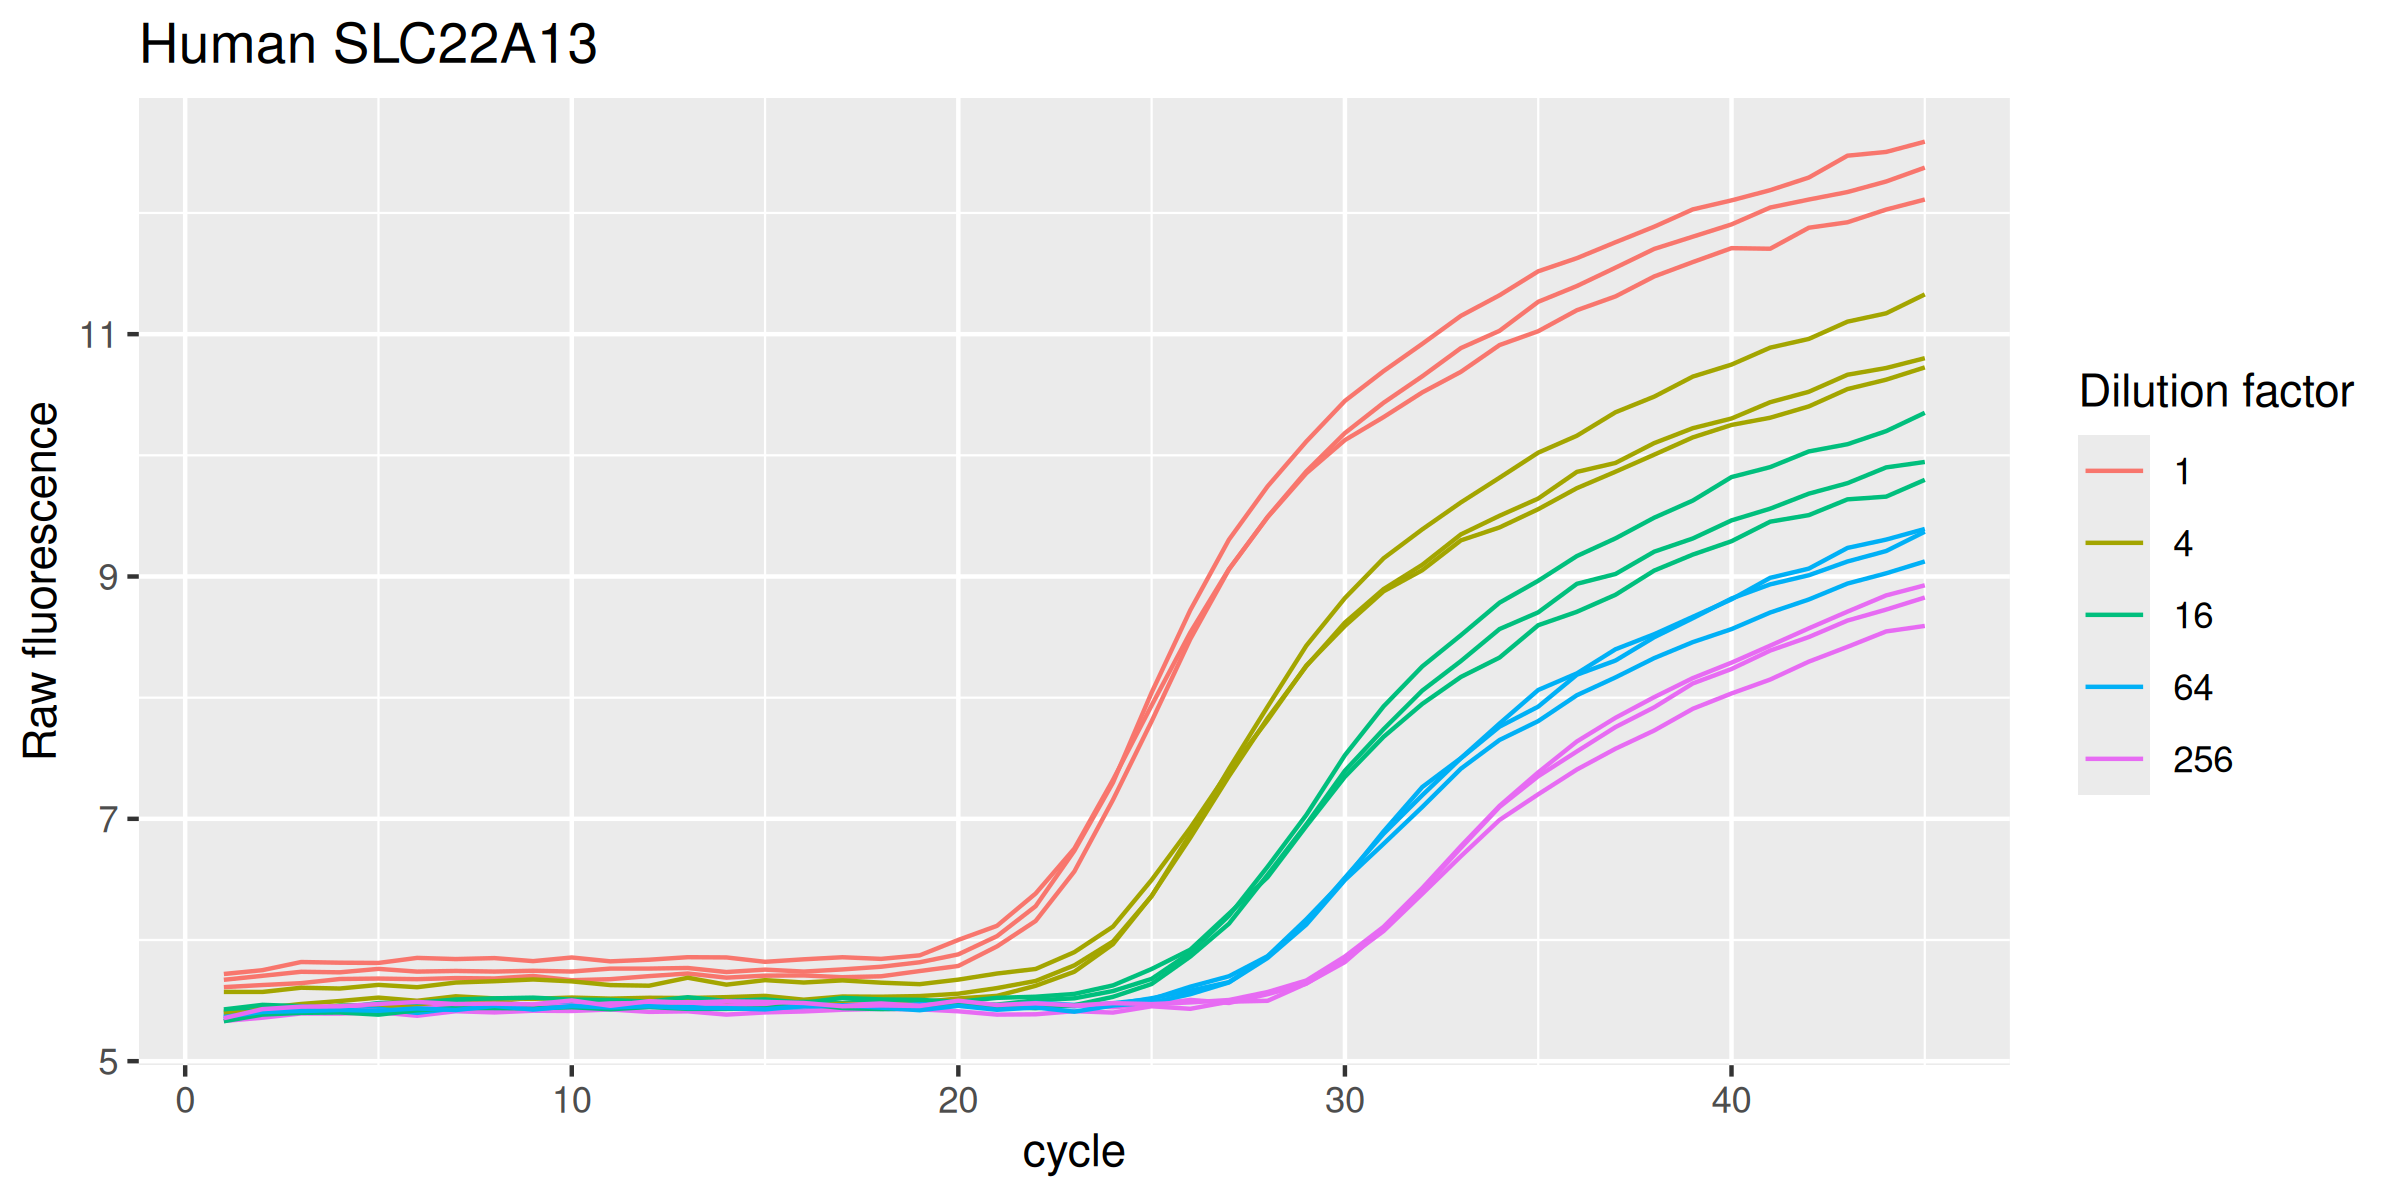
EMTp |>
  ggplot(mapping = aes(
    x = cycle,
    y = fluor,
    group = interaction(dilution, replicate),
    col = as.factor(dilution)
  )) +
  geom_line(linewidth = 0.5) +
  labs(y = "Raw fluorescence", colour = "Dilution factor", title = "Pig EMT") +
  guides(color = guide_legend(override.aes = list(size = 0.5)))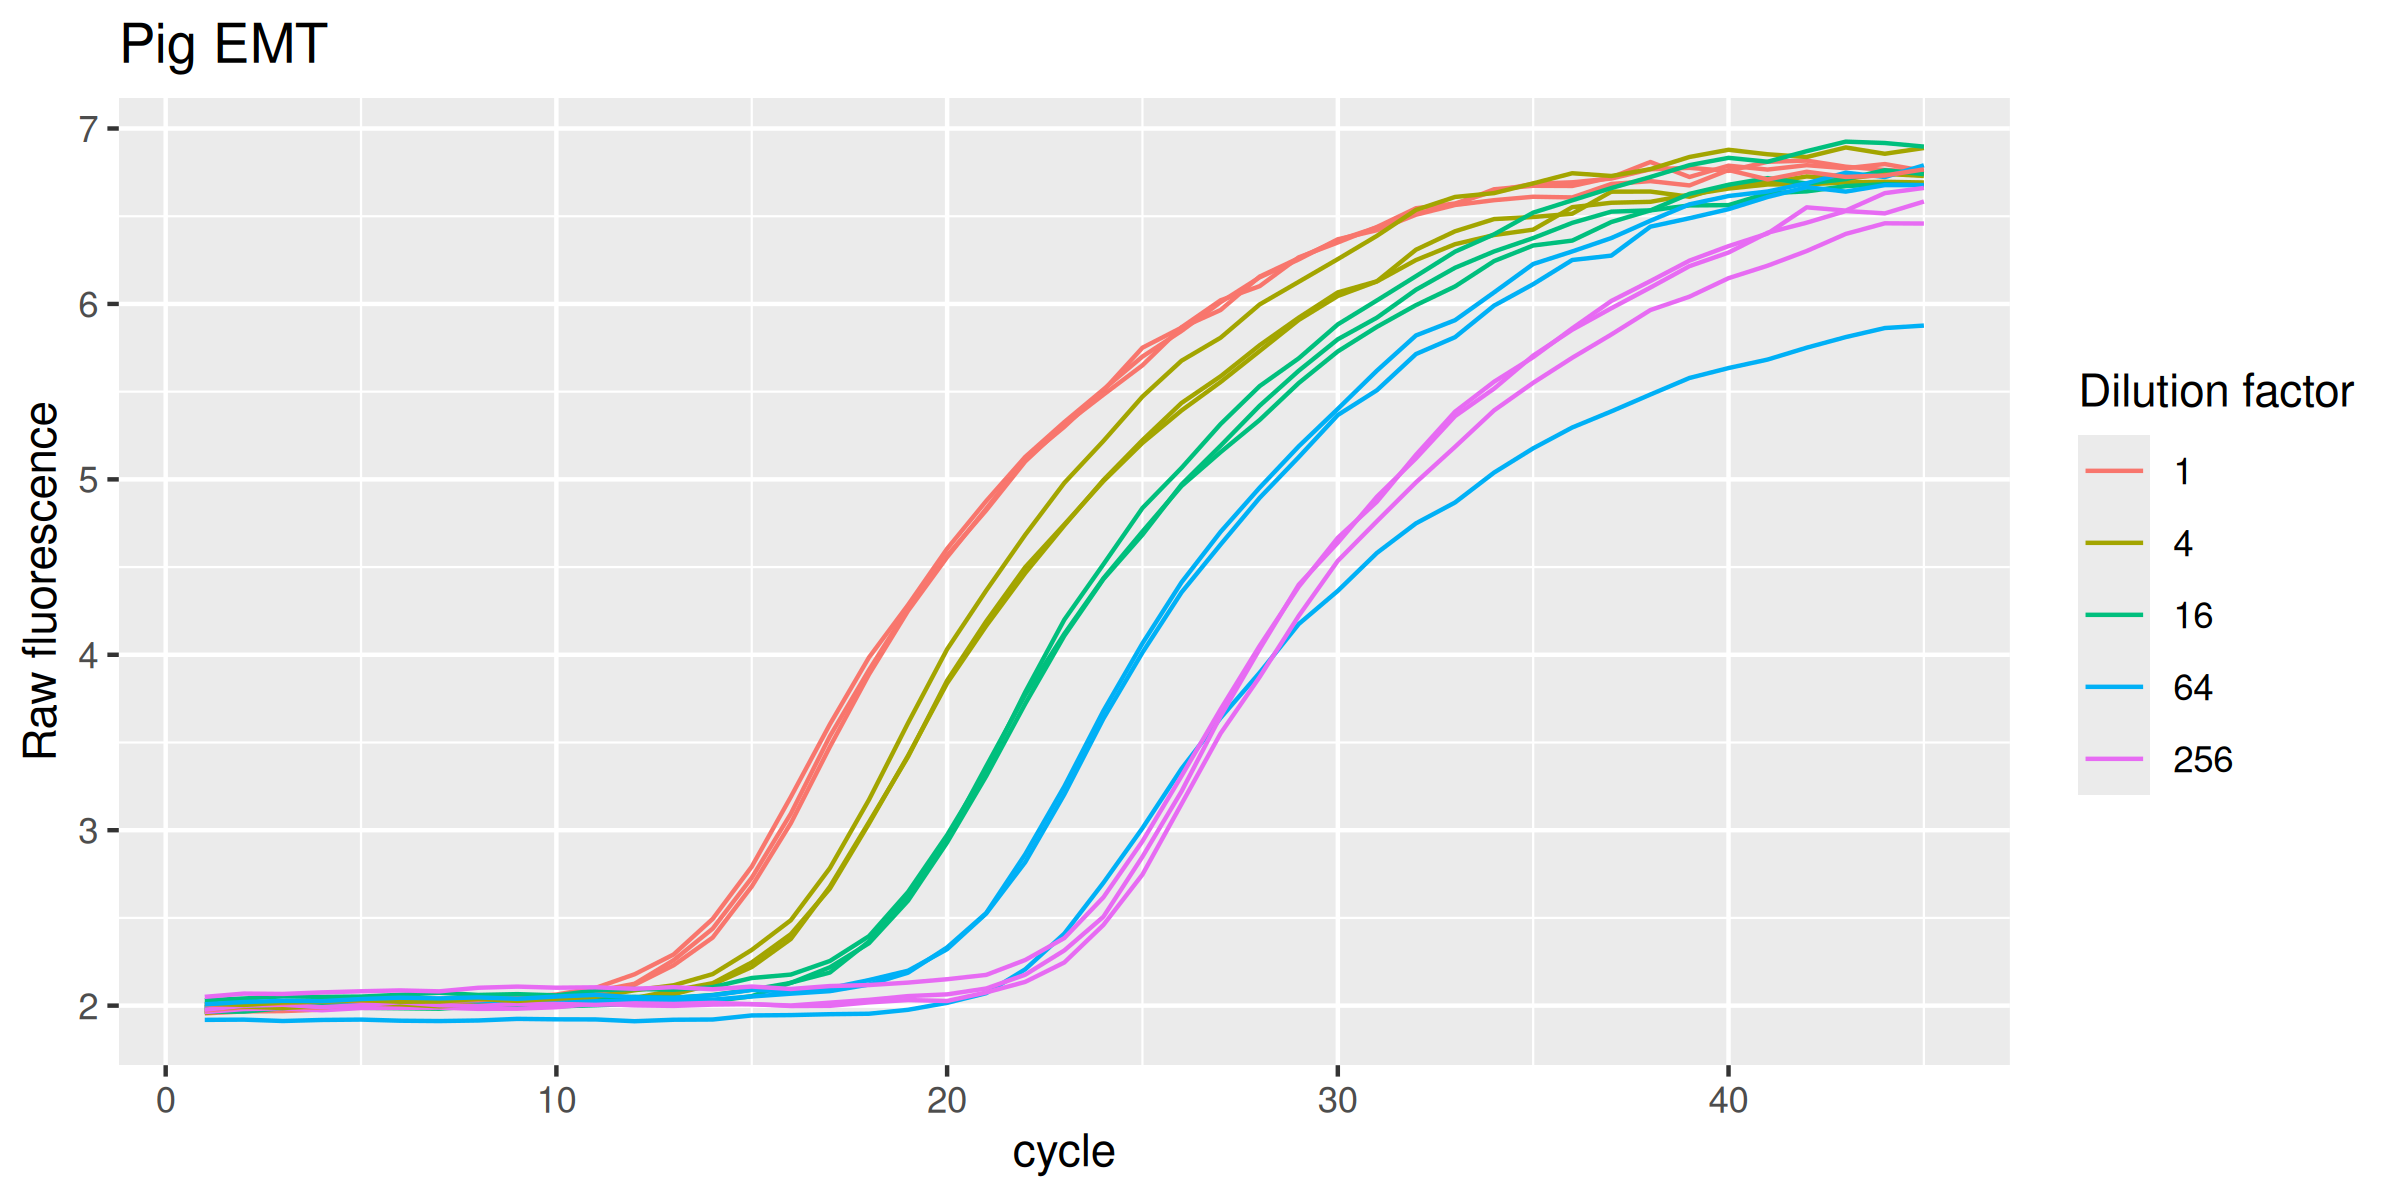
ETTch |>
  ggplot(mapping = aes(
    x = cycle,
    y = fluor,
    group = interaction(dilution, replicate),
    col = as.factor(dilution)
  )) +
  geom_line(linewidth = 0.5) +
  labs(y = "Raw fluorescence", colour = "Dilution factor", title = "Chicken ETT") +
  guides(color = guide_legend(override.aes = list(size = 0.5)))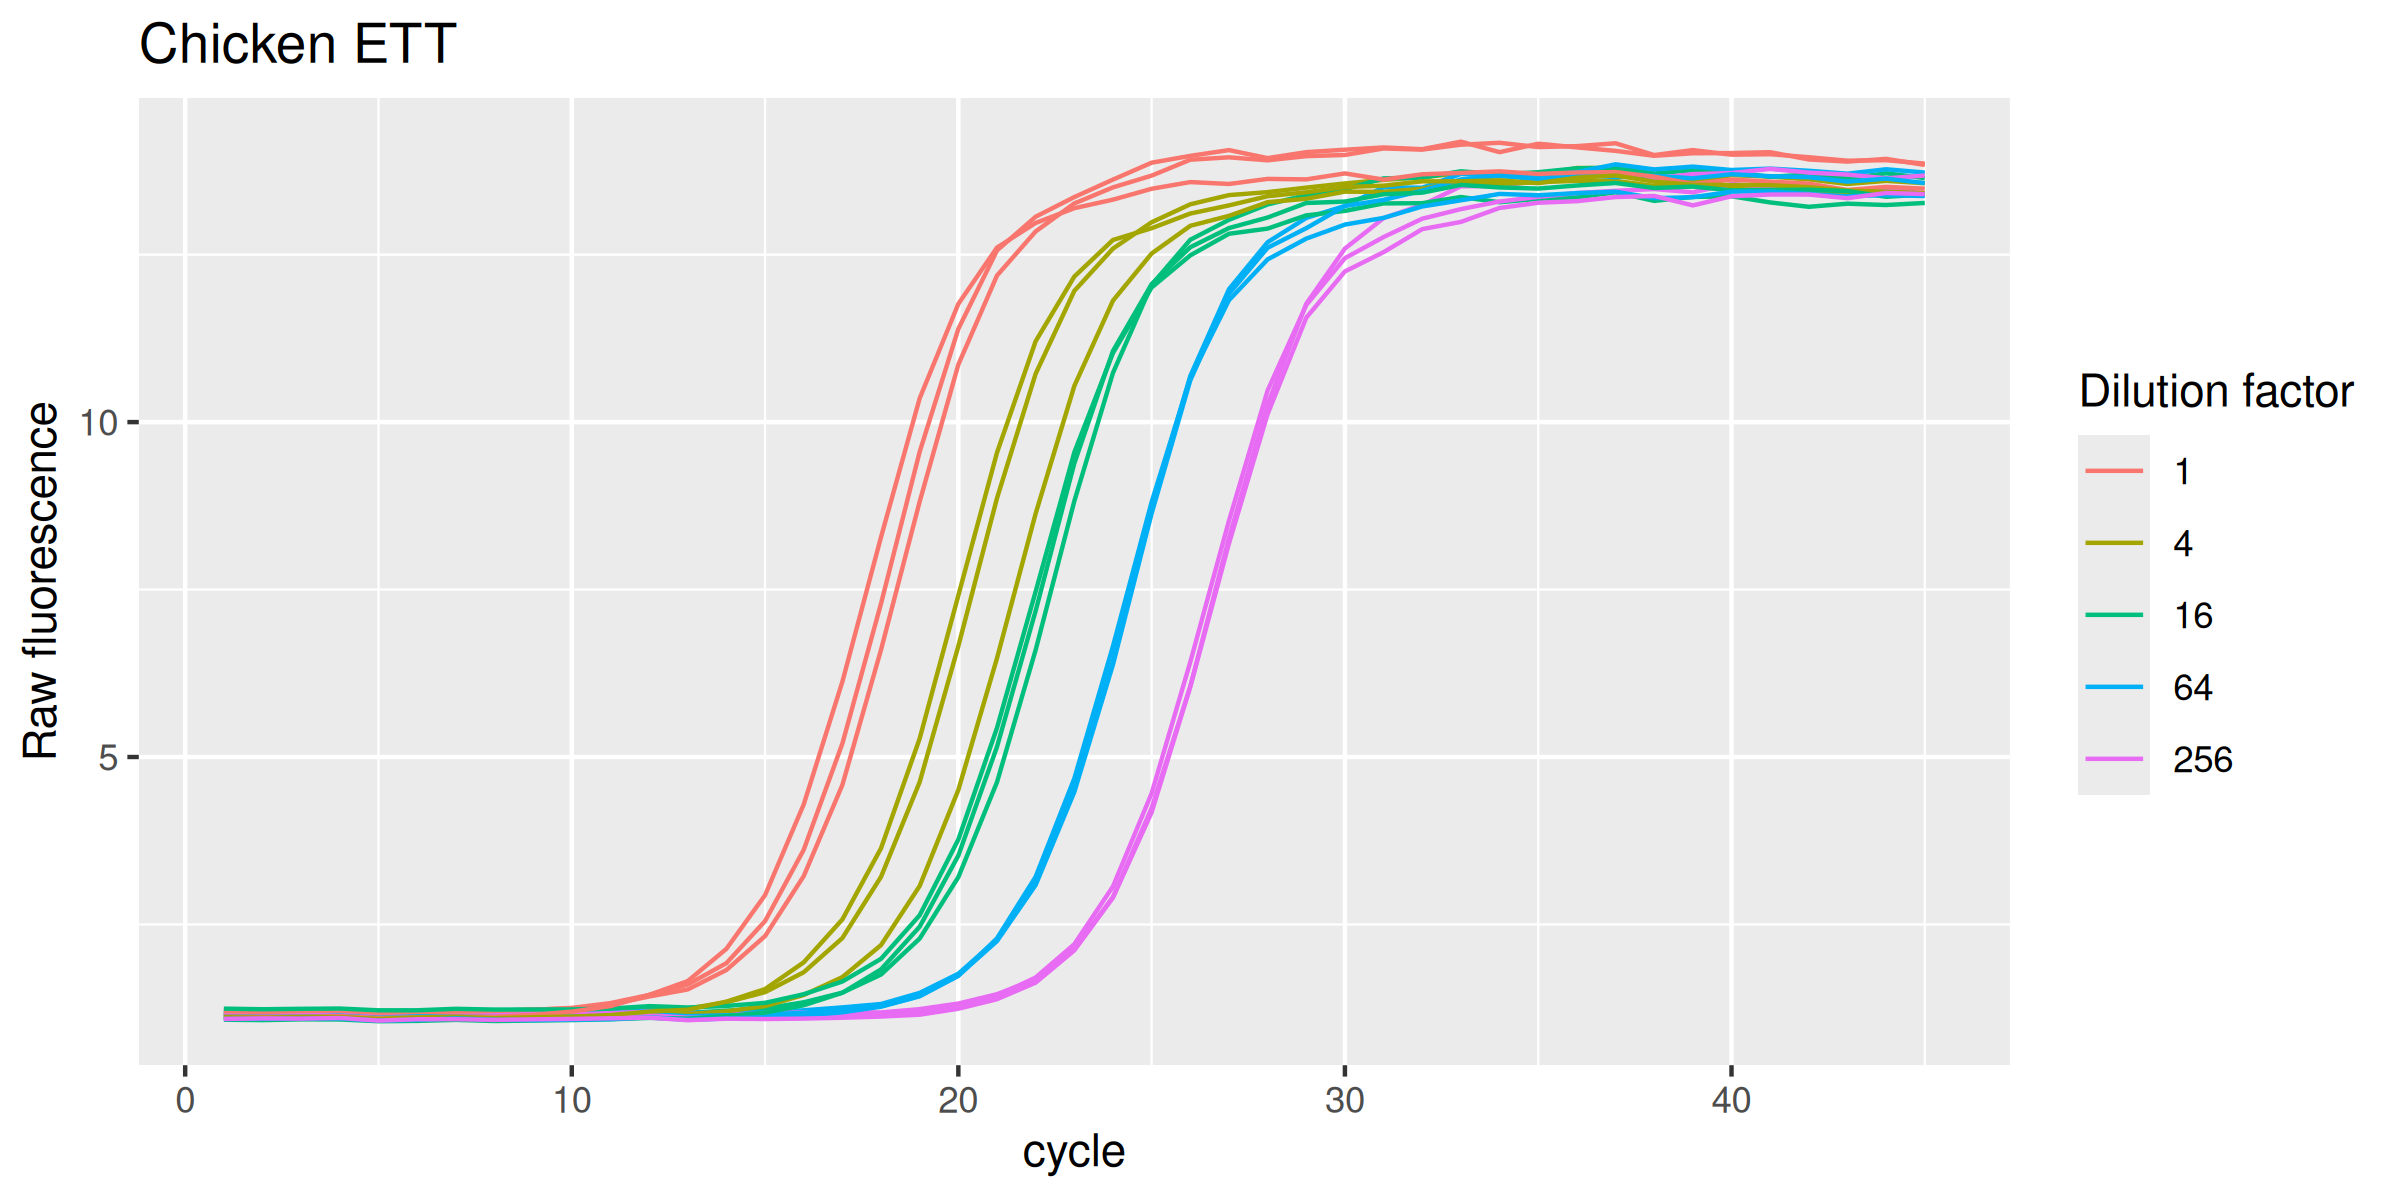
GAPDHh |>
  ggplot(mapping = aes(
    x = cycle,
    y = fluor,
    group = interaction(dilution, replicate),
    col = as.factor(dilution)
  )) +
  geom_line(linewidth = 0.5) +
  labs(y = "Raw fluorescence", colour = "Dilution factor", title = "Human GAPDH") +
  guides(color = guide_legend(override.aes = list(size = 0.5)))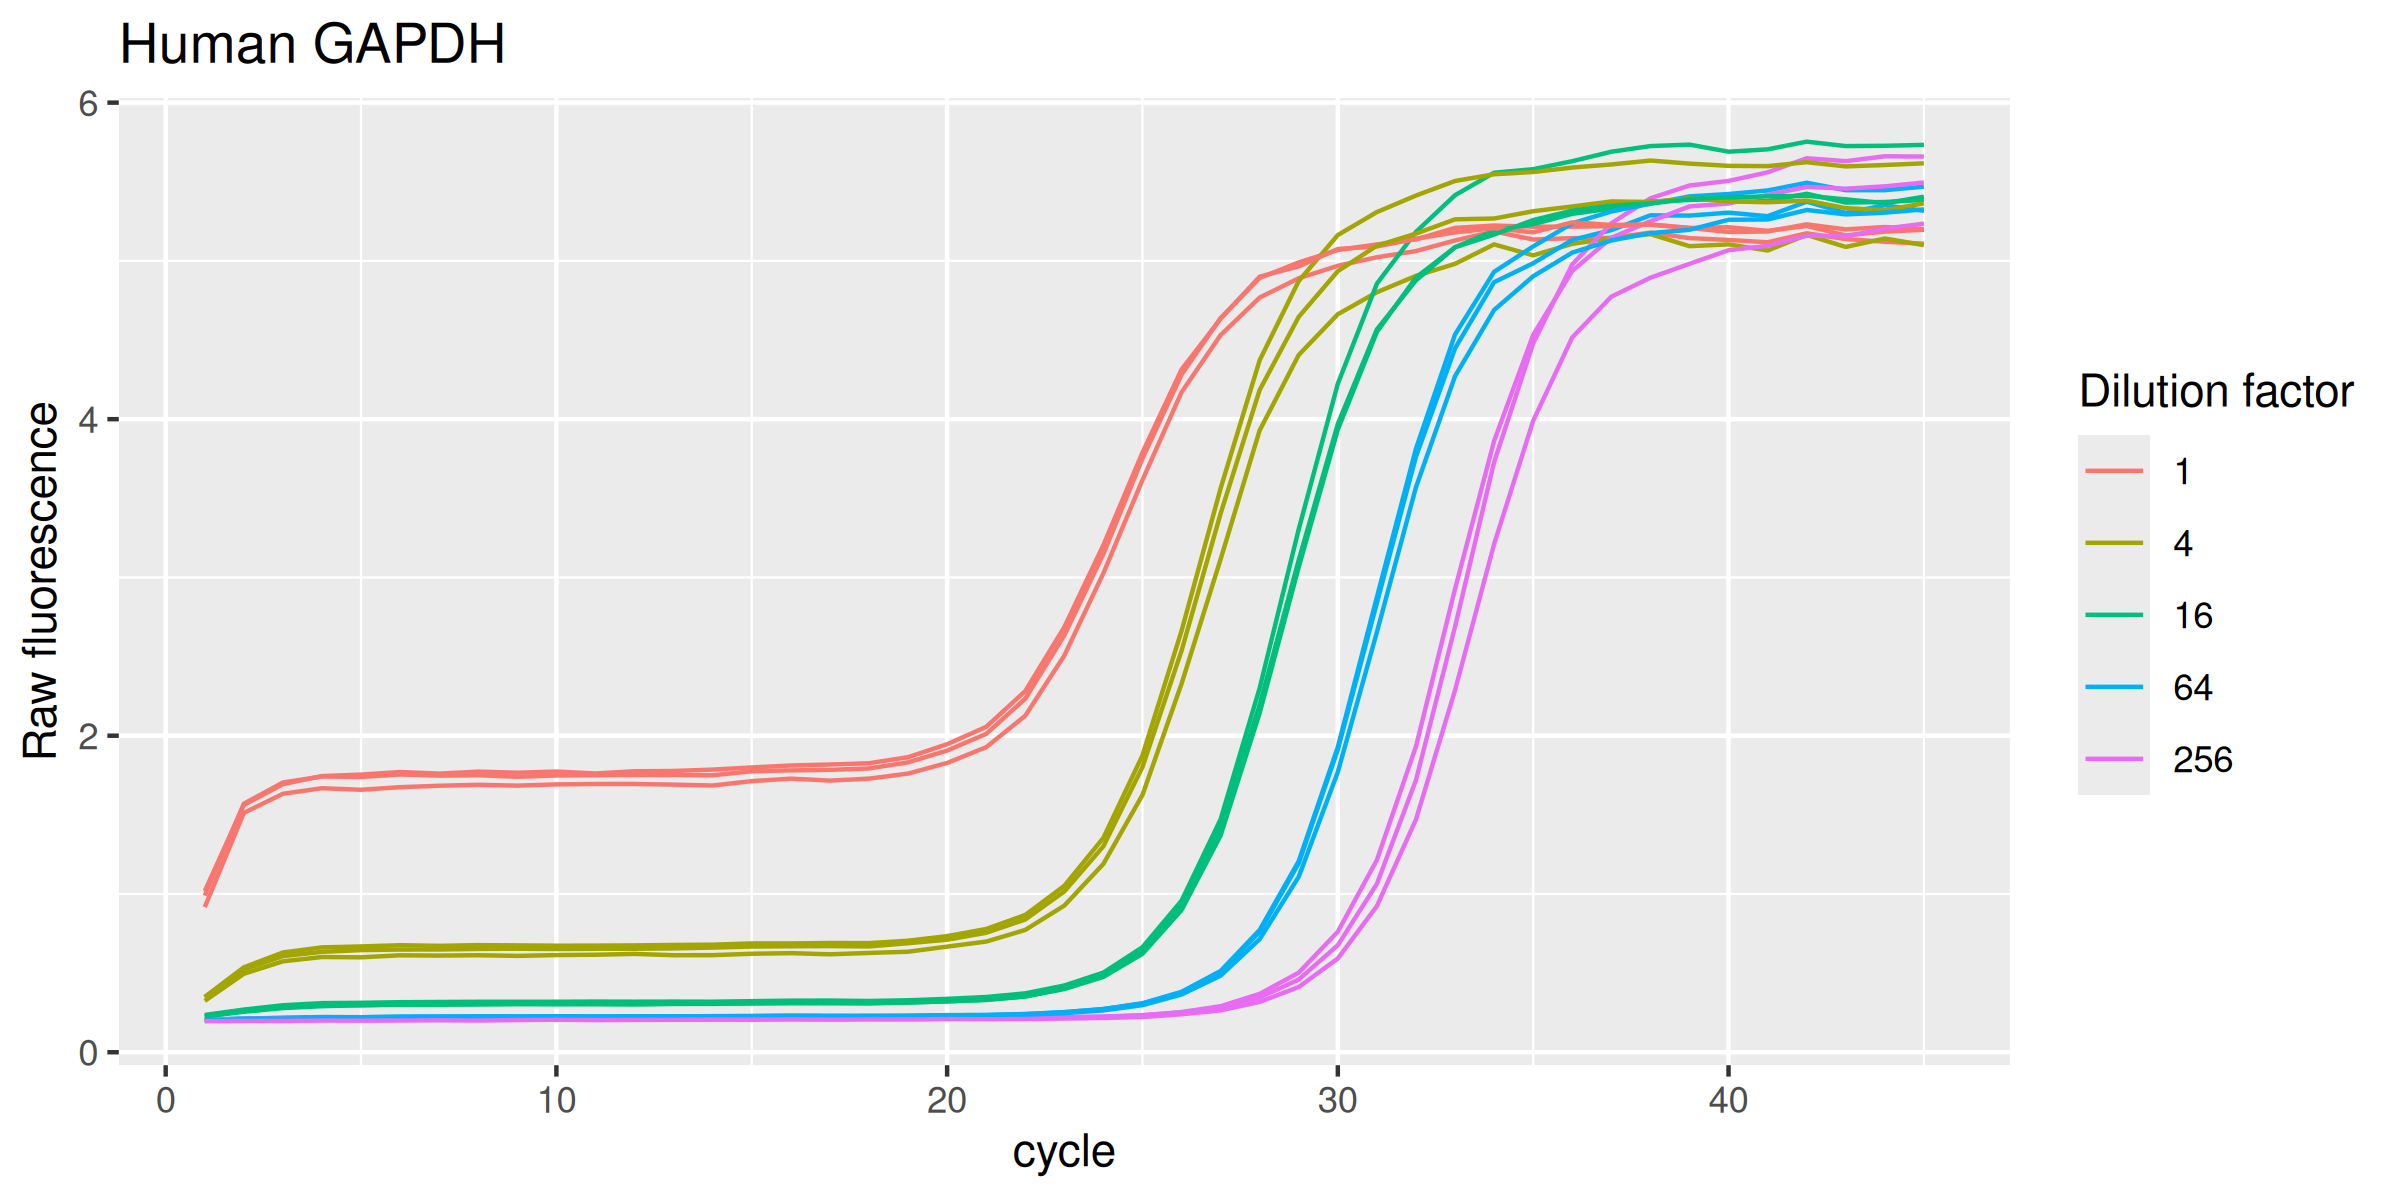
Please note that the {batsch} project is released with a Contributor Code of Conduct. By contributing to this project, you agree to abide by its terms.
These binaries (installable software) and packages are in development.
They may not be fully stable and should be used with caution. We make no claims about them.
Health stats visible at Monitor.