The hardware and bandwidth for this mirror is donated by dogado GmbH, the Webhosting and Full Service-Cloud Provider. Check out our Wordpress Tutorial.
If you wish to report a bug, or if you are interested in having us mirror your free-software or open-source project, please feel free to contact us at mirror[@]dogado.de.
T4cluster is an R package designed as a computational toolkit with comprehensive coverage in relevant topics around the study of cluster analysis. It contains several classes of algorithms for
and other utility functions for further use. If you request additional functionalities or have suggestions, please contact maintainer.
You can install the released version of T4cluster from CRAN with:
install.packages("T4cluster")And the development version from GitHub with:
# install.packages("devtools")
devtools::install_github("kisungyou/T4cluster")T4cluster offers a variety of clustering algorithms
in common interface. In this example, we show a basic pipeline with
smiley dataset, which can be generated as follows;
# load the library
library(T4cluster)

# generate the data
smiley = T4cluster::genSMILEY(n=200)
data   = smiley$data
label  = smiley$label

# visualize
plot(data, pch=19, col=label, xlab="", ylab="", main="SMILEY Data")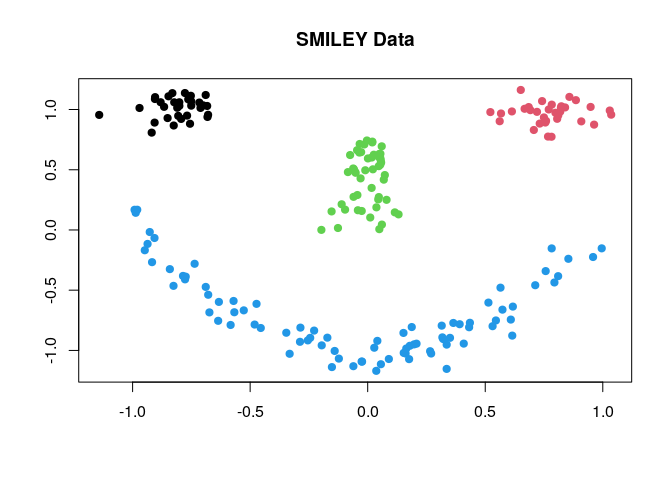
where each component of the face is considered as one cluster - the
data has 4 clusters. Here, we compare 4 different methods; (1)
k-means (kmeans), (2) k-means++
(kmeanspp), (3) gaussian mixture model (gmm),
and (4) spectral clustering with normalized cuts
(scNJW).
# run algorithms
run1 = T4cluster::kmeans(data, k=4)
run2 = T4cluster::kmeanspp(data, k=4)
run3 = T4cluster::gmm(data, k=4)
run4 = T4cluster::scNJW(data, k=4, sigma = 0.1)

# visualize
par(mfrow=c(2,2))
plot(data, pch=19, xlab="", ylab="", col=run1$cluster, main="k-means")
plot(data, pch=19, xlab="", ylab="", col=run2$cluster, main="k-means++")
plot(data, pch=19, xlab="", ylab="", col=run3$cluster, main="gmm")
plot(data, pch=19, xlab="", ylab="", col=run4$cluster, main="scNJW")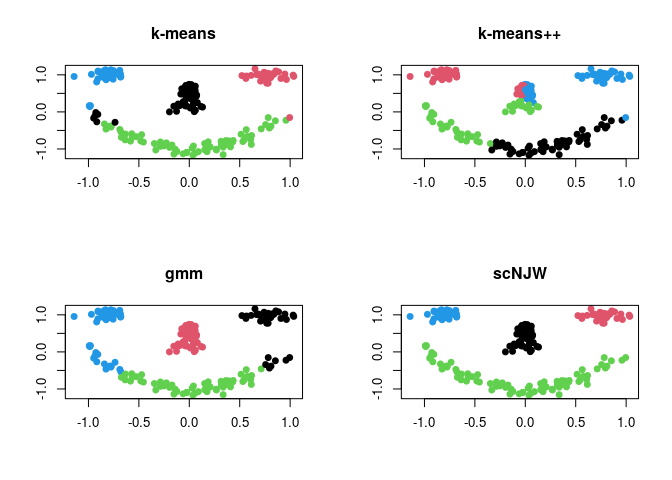
These binaries (installable software) and packages are in development.
They may not be fully stable and should be used with caution. We make no claims about them.
Health stats visible at Monitor.