The hardware and bandwidth for this mirror is donated by dogado GmbH, the Webhosting and Full Service-Cloud Provider. Check out our Wordpress Tutorial.
If you wish to report a bug, or if you are interested in having us mirror your free-software or open-source project, please feel free to contact us at mirror[@]dogado.de.
![]()
Fast computation of Conley (1999) spatial HAC standard errors for regression models with geo-coded data, using the C++ implementation by Darin Christensen (Christensen, Hartman, and Samii 2021). Includes a data-driven bandwidth selection method based on the covariogram range of regression residuals (Lehner 2026).
Install the development version from GitHub:
# install.packages("devtools")
devtools::install_github("axlehner/SpatialInference")A Fortran compiler is required for LAPACK/BLAS. If you encounter gfortran issues, see this thread.
library(SpatialInference)
library(lfe)
data("US_counties_centroids")

# 1. Estimate the correlation range from the covariogram
covgm_range(US_counties_centroids)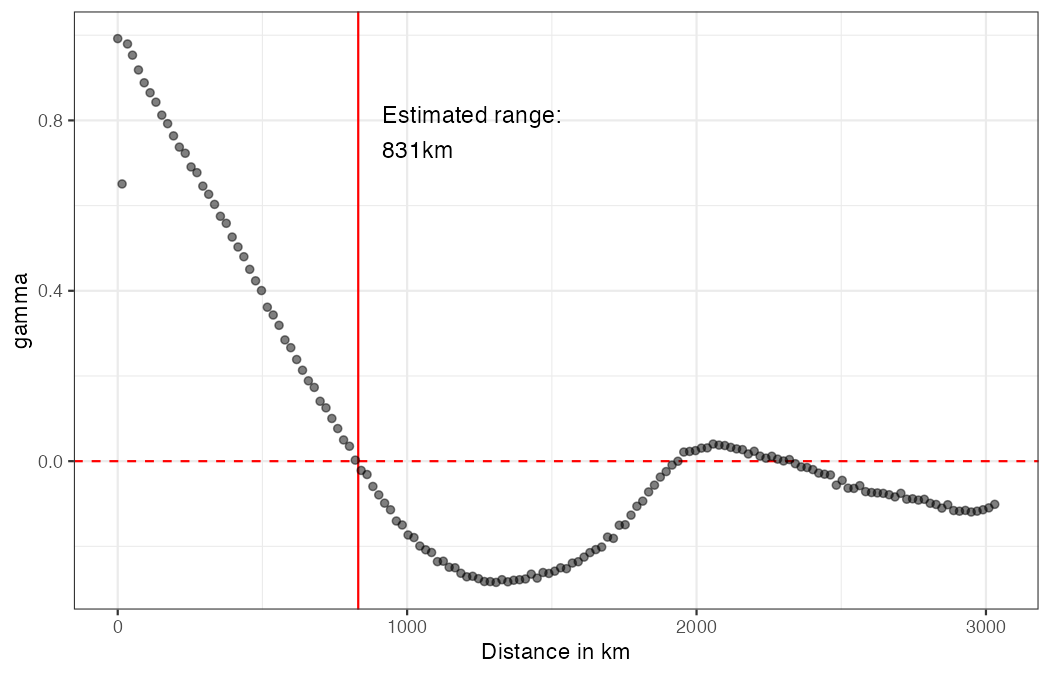
# 2. Compute Conley standard errors at the estimated bandwidth
reg <- felm(noise1 ~ noise2 | unit + year | 0 | lat + lon,
            data = US_counties_centroids, keepCX = TRUE)

vcvs <- conley_SE(reg, unit = "unit", time = "year",
                  lat = "lat", lon = "lon",
                  kernel = "epanechnikov", dist_cutoff = 831)

# Spatial standard errors:
sqrt(diag(vcvs$Spatial))

# Convenience wrapper (returns a single SE):
compute_conley_lfe(reg, cutoff = 831, kernel_choice = "epanechnikov")
# 3. Visualise the inverse-U relationship
inverseu_plot_conleyrange(US_counties_centroids,
cutoffrange = seq(1, 2501, by = 200))| Function | Description |
|---|---|
conley_SE() |
Conley spatial HAC variance-covariance matrices (spatial, serial, and combined) |
compute_conley_lfe() |
Convenience wrapper returning a single Conley SE |
covgm_range() |
Estimate and plot the correlation range from a covariogram |
extract_corr_range() |
Extract the zero-crossing range from a covariogram or correlogram |
inverseu_plot_conleyrange() |
Diagnostic plot of SE vs. bandwidth (inverse-U) |
lm_sac() |
All-in-one: regression + Moran’s I + Conley SEs |
DistMat() |
Kernel-weighted spatial distance matrix (C++) |
Lehner, A. (2026). Bandwidth selection for spatial HAC standard errors. arXiv preprint arXiv:2603.03997. doi:10.48550/arXiv.2603.03997
Conley, T. G. (1999). GMM estimation with cross sectional dependence. Journal of Econometrics, 92(1), 1–45. doi:10.1016/S0304-4076(98)00084-0
Christensen, D., Hartman, A. C. and Samii, C. (2021). Legibility and external investment: An institutional natural experiment in Liberia. International Organization, 75(4), 1087–1108. doi:10.1017/S0020818321000187
These binaries (installable software) and packages are in development.
They may not be fully stable and should be used with caution. We make no claims about them.
Health stats visible at Monitor.