The hardware and bandwidth for this mirror is donated by dogado GmbH, the Webhosting and Full Service-Cloud Provider. Check out our Wordpress Tutorial.
If you wish to report a bug, or if you are interested in having us mirror your free-software or open-source project, please feel free to contact us at mirror[@]dogado.de.
![]()
![]()
![]()
The goal of OmopSketch is to characterise and visualise an Observational Medical Outcomes Partnership (OMOP) Common Data Model (CDM) instance to asses if it meets the necessary criteria to answer a specific clinical question and conduct a certain study.
OmopSketch is available from CRAN:
install.packages("OmopSketch")Or you can install the development version of OmopSketch from GitHub with:
# install.packages("remotes")
remotes::install_github("OHDSI/OmopSketch")To be able to use this package you will need data mapped to the OMOP CDM.
The first step to any analysis you will create what we call the
cdm_reference object, which is a reference to the OMOP CDM
tables. If you want to learn more about OMOP or the
cdm_reference object you can take a look to:
In general, you will create a cdm_reference object using the CDMConnector package, in our case we will use the Eunomia GiBleed mock dataset available through omock:
library(omock)

cdm <- mockCdmFromDataset(datasetName = "GiBleed", source = "duckdb")
#> ℹ Reading GiBleed tables.
#> ℹ Adding drug_strength table.
#> ℹ Creating local <cdm_reference> object.
#> ℹ Inserting <cdm_reference> into duckdb.
cdm
#>
#> ── # OMOP CDM reference (duckdb) of GiBleed ────────────────────────────────────
#> • omop tables: care_site, cdm_source, concept, concept_ancestor, concept_class,
#> concept_relationship, concept_synonym, condition_era, condition_occurrence,
#> cost, death, device_exposure, domain, dose_era, drug_era, drug_exposure,
#> drug_strength, fact_relationship, location, measurement, metadata, note,
#> note_nlp, observation, observation_period, payer_plan_period, person,
#> procedure_occurrence, provider, relationship, source_to_concept_map, specimen,
#> visit_detail, visit_occurrence, vocabulary
#> • cohort tables: -
#> • achilles tables: -
#> • other tables: -library(OmopSketch)
library(dplyr)
#>
#> Attaching package: 'dplyr'
#> The following objects are masked from 'package:stats':
#>
#> filter, lag
#> The following objects are masked from 'package:base':
#>
#> intersect, setdiff, setequal, unionOnce we have the cdm_reference object we can start
characterising it, there are several functionalities available on
OmopSketch the main ones:
We first create a snapshot of our database. This will allow us to track when the analysis has been conducted and capture details about the CDM version or the data release.
snapshot <- summariseOmopSnapshot(cdm = cdm)

tableOmopSnapshot(result = snapshot, type = "flextable")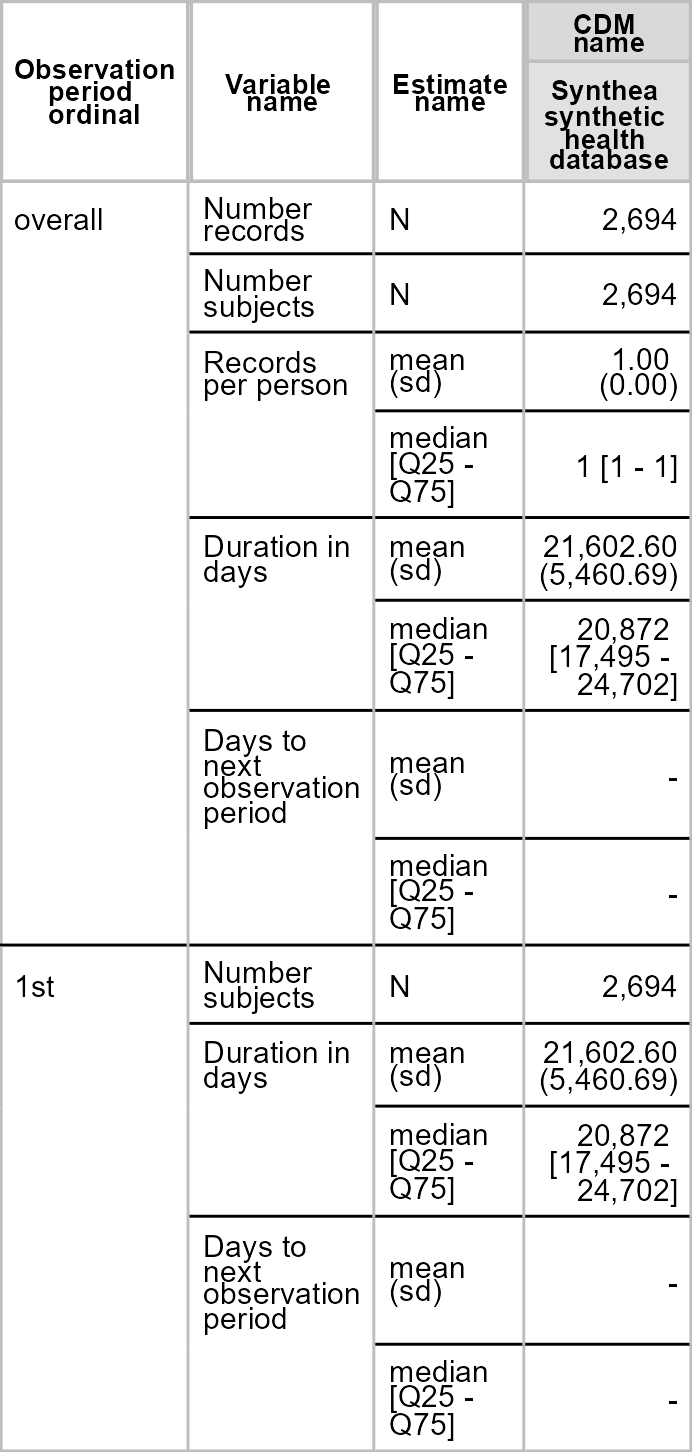
Once we have collected the snapshot information, we can characterise
the person table with summarisePersonTable():
result <- summarisePerson(cdm = cdm)

tablePerson(result = result, type = "flextable")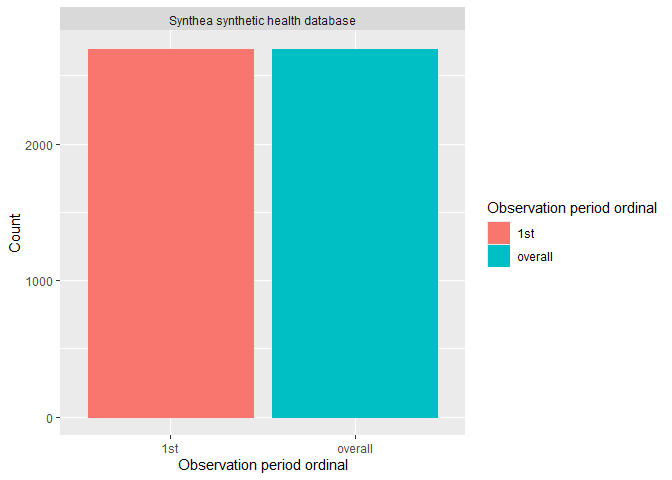
We can then explore the observation period details. You can visualise
and explore the characteristics of the observation period per each
individual in the database using
summariseObservationPeriod().
result <- summariseObservationPeriod(cdm = cdm)
#> Warning: ! There are 2649 individuals not included in the person table.

tableObservationPeriod(result = result, type = "flextable")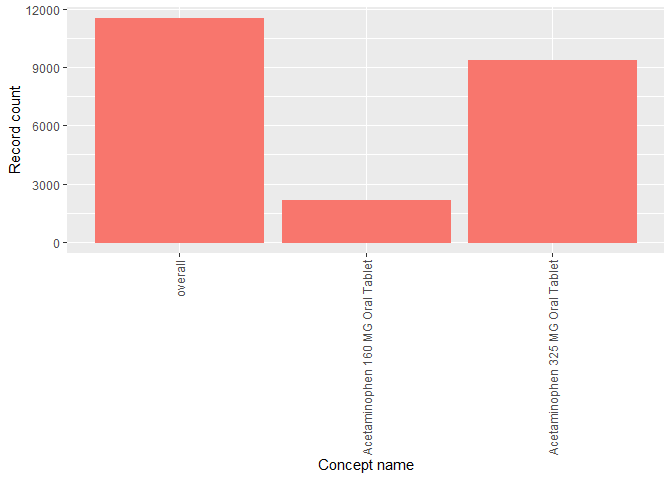
Or if visualisation is preferred, you can easily build a histogram to explore how many participants have more than one observation period.
plotObservationPeriod(result = result, colour = "observation_period_ordinal")
Now, we can start characterising the clinical tables of the CDM. By
using summariseClinicalRecords() and
tableClinicalRecords(), we can easily visualise the main
characteristics of specific clinical tables.
result <- summariseClinicalRecords(
  cdm = cdm,
  omopTableName = c("condition_occurrence", "drug_exposure")
)
#> ℹ Adding variables of interest to condition_occurrence.
#> ℹ Summarising records per person in condition_occurrence.
#> ℹ Summarising subjects not in person table in condition_occurrence.
#> ℹ Summarising records in observation in condition_occurrence.
#> ℹ Summarising records with start before birth date in condition_occurrence.
#> ℹ Summarising records with end date before start date in condition_occurrence.
#> ℹ Summarising domains in condition_occurrence.
#> ℹ Summarising standard concepts in condition_occurrence.
#> ℹ Summarising source vocabularies in condition_occurrence.
#> ℹ Summarising concept types in condition_occurrence.
#> ℹ Summarising missing data in condition_occurrence.
#> ℹ Adding variables of interest to drug_exposure.
#> ℹ Summarising records per person in drug_exposure.
#> ℹ Summarising subjects not in person table in drug_exposure.
#> ℹ Summarising records in observation in drug_exposure.
#> ℹ Summarising records with start before birth date in drug_exposure.
#> ℹ Summarising records with end date before start date in drug_exposure.
#> ℹ Summarising domains in drug_exposure.
#> ℹ Summarising standard concepts in drug_exposure.
#> ℹ Summarising source vocabularies in drug_exposure.
#> ℹ Summarising concept types in drug_exposure.
#> ℹ Summarising concept class in drug_exposure.
#> ℹ Summarising missing data in drug_exposure.

tableClinicalRecords(result = result, type = "flextable")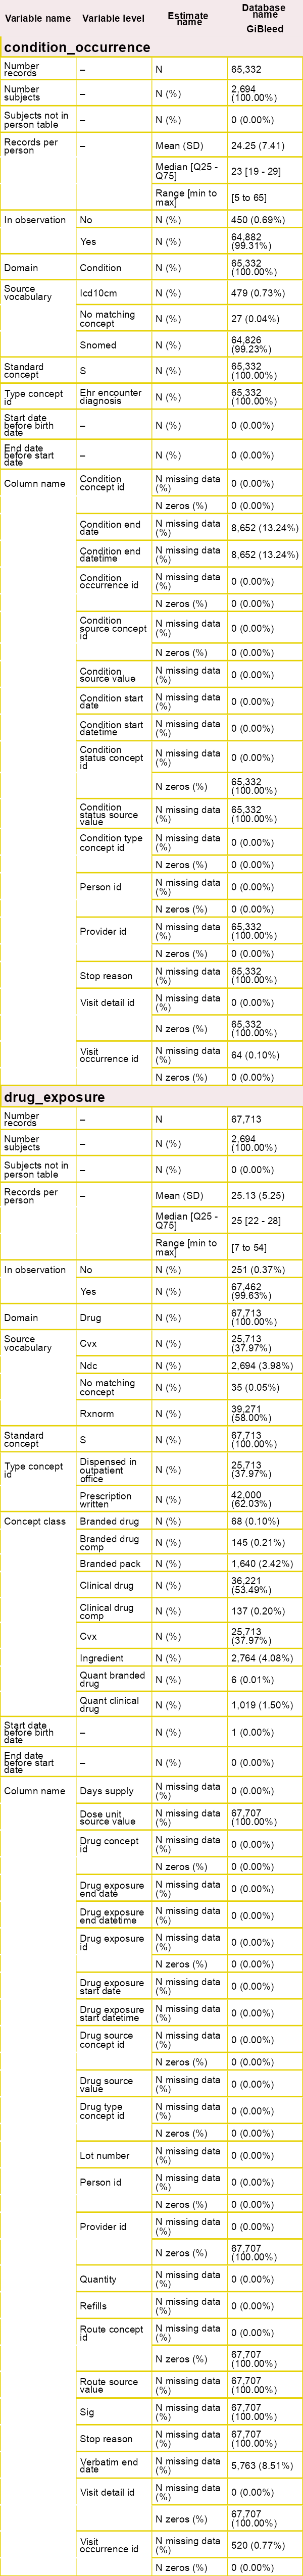
After visualising the main characteristics of our clinical tables, we
can also explore trends over time using
summariseTrend().
result <- summariseTrend(
  cdm = cdm,
  event = c("condition_occurrence", "drug_exposure"),
  output = "record",
  interval = "years"
)

plotTrend(result = result, facet = "omop_table", colour = "cdm_name")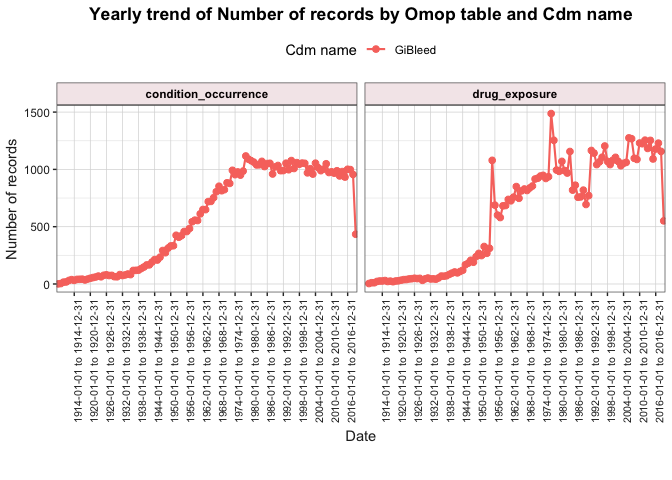
OmopSketch also provides functions to explore the concepts in the dataset.
result <- summariseConceptIdCounts(
  cdm = cdm,
  omopTableName = "drug_exposure"
)

tableTopConceptCounts(result = result, type = "flextable")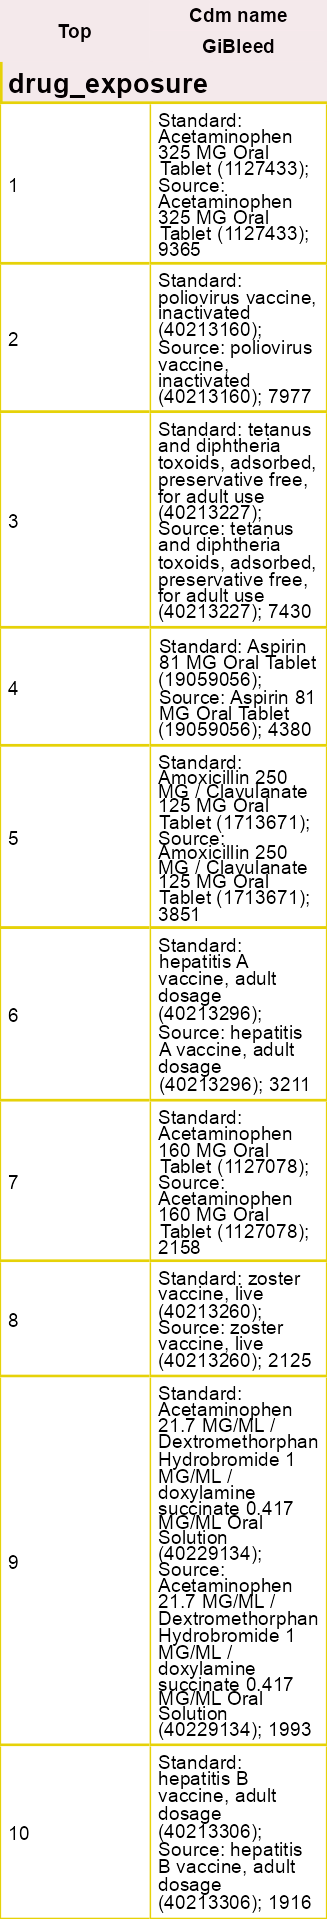
To obtain and explore a complete characterisation of a cdm, you can
use the OmopSketch functions databaseCharacteristics() and
shinyCharacteristics(). These functions allow you to
generate and interactively explore detailed summaries of your database.
To see an example of the outputs produced, explore the characterisation
of several synthetic datasets here.
As seen, OmopSketch offers multiple functionalities to provide a general overview of a database. Additionally, it includes more tools and arguments that allow for deeper exploration, helping to assess the database’s suitability for specific research studies. For further information, please refer to the vignettes.
These binaries (installable software) and packages are in development.
They may not be fully stable and should be used with caution. We make no claims about them.
Health stats visible at Monitor.