The hardware and bandwidth for this mirror is donated by dogado GmbH, the Webhosting and Full Service-Cloud Provider. Check out our Wordpress Tutorial.
If you wish to report a bug, or if you are interested in having us mirror your free-software or open-source project, please feel free to contact us at mirror[@]dogado.de.
MultiModalR performs Bayesian mixture modeling for multimodal data. It detects subpopulations and assigns probabilistic memberships using two advanced Markov Chain Monte Carlo (MCMC) algorithms implemented in optimized C++:
Metropolis-Hastings within Gibbs Sampler for Gaussian Mixture Models - Fast and robust
Dirichlet-Multinomial (collapsed Gibbs) - Slower and rigorously robust
Rcpp, RcppArmadillo, dplyr,
furrr, future
# From CRAN (recommended)
install.packages("MultiModalR")

# Development version from GitHub
devtools::install_github("DijoG/MultiModalR")library(MultiModalR)
# Load data
df <- MultiModalR::multimodal_dummy
# Run analysis with default settings
results <- fuss_PARALLEL_mcmc(
data = df,
varCLASS = "Category",
varY = "Value",
varID = "ID"
)
# View results summary
summary(results)MultiModalR::fuss_PARALLEL_mcmc(
data = df, # 📦 -> required
varCLASS = "Category", # 🏷️ -> required
varY = "Value", # 📈 -> required
varID = "ID", # 🆔 -> required
method = "sj-dpi", # 📏 /default
within = 1, # 🎯 /default
maxNGROUP = 5, # 🔢 /default
out_dir = ".../output", # 💾 -> optional
n_workers = 3, # ⚡ /default
n_iter = NULL, # 🔄 /default
burnin = NULL, # 🔥 /default
proposal_sd = 0.15, # 📊 /default
sj_adjust = 0.5, # ⚖️ /default
mcmc_method = "metropolis", # 🧮 /default
dirichlet_alpha = 2.0 # 🎲 /default
)library(MultiModalR)
# Load the built-in dataset
df <- MultiModalR::multimodal_dummy
# View the data structure
head(df)
str(df)library(ggplot2)
# Plot 01 ~ subpopulations/subgroups not shown
ggplot(df, aes(x = Value)) +
geom_density(color = NA, fill = "grey98", adjust = .8) +
facet_wrap(~Category) +
theme_dark() +
labs(title = "Multimodal Data ~ Density",
x = "Value", y = "Density") +
scale_y_continuous(expand = expansion(mult = c(0, 0))) +
scale_x_continuous(expand = expansion(mult = c(0, 0))) +
theme(legend.position = "top",
axis.text.y = element_blank(),
axis.ticks = element_blank(),
panel.grid.major = element_blank(), panel.grid.minor = element_blank(),
plot.title = element_text(hjust = .5))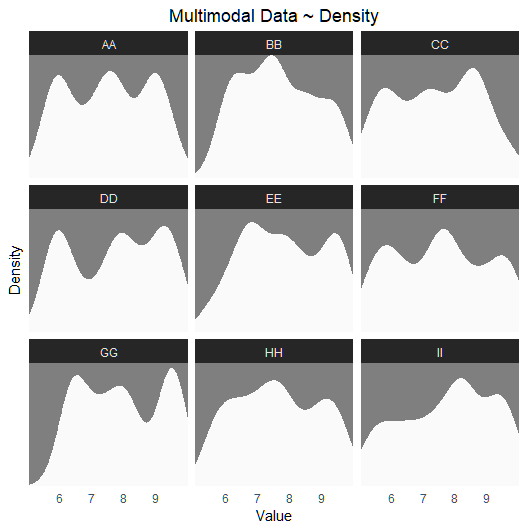
# Plot 02 ~ subgroups shown
ggplot(df, aes(x = Value, fill = Subpopulation)) +
  geom_density(alpha = 0.5, color = NA) +
  scale_fill_manual(values = c("firebrick2", "forestgreen", "cyan3"),
                     name = "Subgroups") +
  facet_wrap(~Category) +
  theme_dark() +
  labs(title = "Multimodal Data ~ Density with Subgroups",
       x = "Value", y = "Density") +
  scale_y_continuous(expand = expansion(mult = c(0, 0))) +
  scale_x_continuous(expand = expansion(mult = c(0, 0))) +
  theme(legend.position = "top",
        legend.key = element_rect(fill = "transparent", color = NA),
        axis.text.y = element_blank(),
        axis.ticks = element_blank(),
        panel.grid.major = element_blank(), panel.grid.minor = element_blank(),
        plot.title = element_text(hjust = .5)) +
  guides(fill = guide_legend(override.aes = list(alpha = .6)))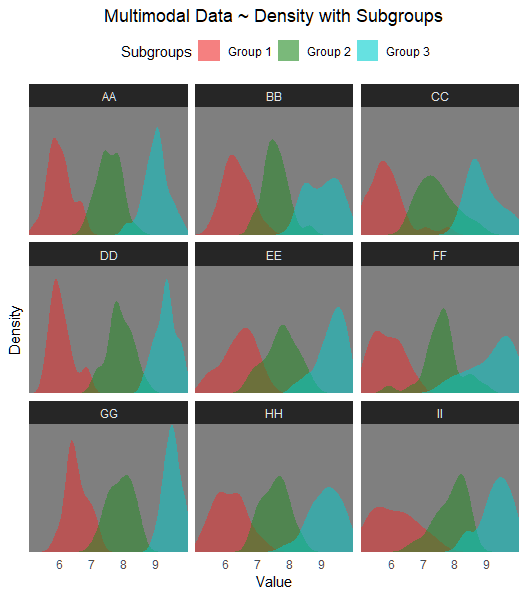
# Configure parallel processing
cores <- 3# Dirichlet MCMC
MultiModalR::fuss_PARALLEL_mcmc(
data = df,
varCLASS = "Category",
varY = "Value",
varID = "ID",
out_dir = "D:/MultiModalR/test",
n_workers = cores,
mcmc_method = "dirichlet"
)
tictoc::toc()
# Processing time: 5.19 sec (3 cores) ~ 91.4% overall accuracy
# -- OR (recommended default) -->
# Metropolis-Hastings within Gibbs Sampler for Gaussian Mixture Models
MultiModalR::fuss_PARALLEL_mcmc(
data = df,
varCLASS = "Category",
varY = "Value",
varID = "ID",
out_dir = "D:/MultiModalR/test",
n_workers = cores
)
tictoc::toc()
# Processing time: 3.18 sec (3 cores) ~ 92% overall accuracyThe function generates: - Data CSV files: Original data with assigned subgroups and probabilities
A Data CSV file consists of the following fields
(maxNGROUP = 5): - y: Original/observed value -
Group: Original/observed subgroup - Group_1:
Predicted belonging probability to - Group_2: Predicted
belonging probability to - Group_3: Predicted belonging
probability to - Group_4: Predicted belonging probability
to - Group_5: Predicted belonging probability to -
Assigned_Group: Assigned/predicted subgroup -
Min_Assigned: Minimum value of the assigned/predicted range
- Max_Assigned: Maximum value of the assigned/predicted
range - Mean_Assigned: Mean value of the assigned/predicted
range - Mode_Assigned: Mode of the assigned/predicted range
- Main_Class: Category/main group/class
# Validate subgroup assignments
MultiModalR::plot_VALIDATION(
  "D:/MultiModalR/test",
  df,
  subpop_col = "Subpopulation",
  value_col = "Value",
  id_col = "ID")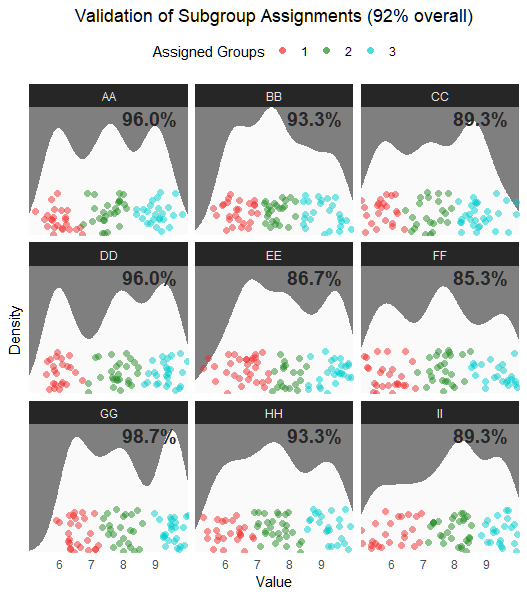
Validation results show accurate subgroup assignments across categories.
You can also generate custom multimodal data with different parameters:
# Generate custom dataset
custom_data <- MultiModalR::create_multimodal_dummy(
  seed = 12,
  n_categories = 6,
  n_per_group = 30,
  n_subgroups = 4
)If you use MultiModalR in your research, please cite the original paper: after publication
These binaries (installable software) and packages are in development.
They may not be fully stable and should be used with caution. We make no claims about them.
Health stats visible at Monitor.