The hardware and bandwidth for this mirror is donated by dogado GmbH, the Webhosting and Full Service-Cloud Provider. Check out our Wordpress Tutorial.
If you wish to report a bug, or if you are interested in having us mirror your free-software or open-source project, please feel free to contact us at mirror[@]dogado.de.
![]()
The goal of MetabolomicsBasics is to provide a set of functions to investigate raw data (a matrix of intensity values) from (metabol)omics experiments, i.e. following peak picking and signal deconvolution. Functions can be used to i.e.:
A detailed description of best practice usage may be found in the publication https://link.springer.com/protocol/10.1007/978-1-4939-7819-9_20.
You can install the development version of MetabolomicsBasics from GitHub with:
# install.packages("devtools")
devtools::install_github("janlisec/MetabolomicsBasics")A typical use case would be to compute a Principal Component Analysis:
raw <- MetabolomicsBasics::raw
sam <- MetabolomicsBasics::sam
MetabolomicsBasics::RestrictedPCA(dat = raw, sam = sam, group.col = "Group", legend.x = "bottomleft", medsd = TRUE, fmod = "Group")
More
elaborate plots, like the polar coordinate visualization of heterosis
pattern are possible:
More
elaborate plots, like the polar coordinate visualization of heterosis
pattern are possible:
x <- t(raw)
colnames(x) <- sam$GT
MetabolomicsBasics::PolarCoordHeterPlot(x=x, gt=c("B73","B73xMo17","Mo17"), plot_lab="graph", col=1:10, thr=0.5, rev_log=exp(1))
#> Parameter 'col' should be a color vector of length nrow(x)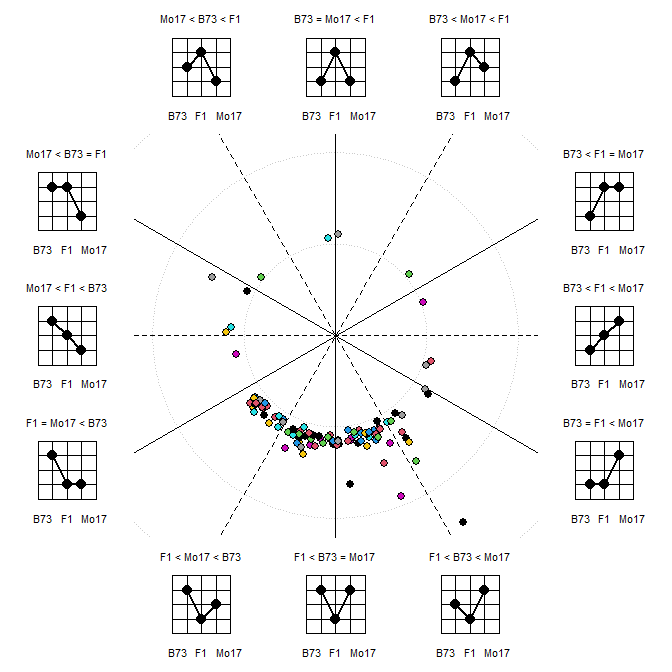
These binaries (installable software) and packages are in development.
They may not be fully stable and should be used with caution. We make no claims about them.
Health stats visible at Monitor.