The hardware and bandwidth for this mirror is donated by dogado GmbH, the Webhosting and Full Service-Cloud Provider. Check out our Wordpress Tutorial.
If you wish to report a bug, or if you are interested in having us mirror your free-software or open-source project, please feel free to contact us at mirror[@]dogado.de.
![]()
![]()
An R Package to read and analyze MetIDQ™ output
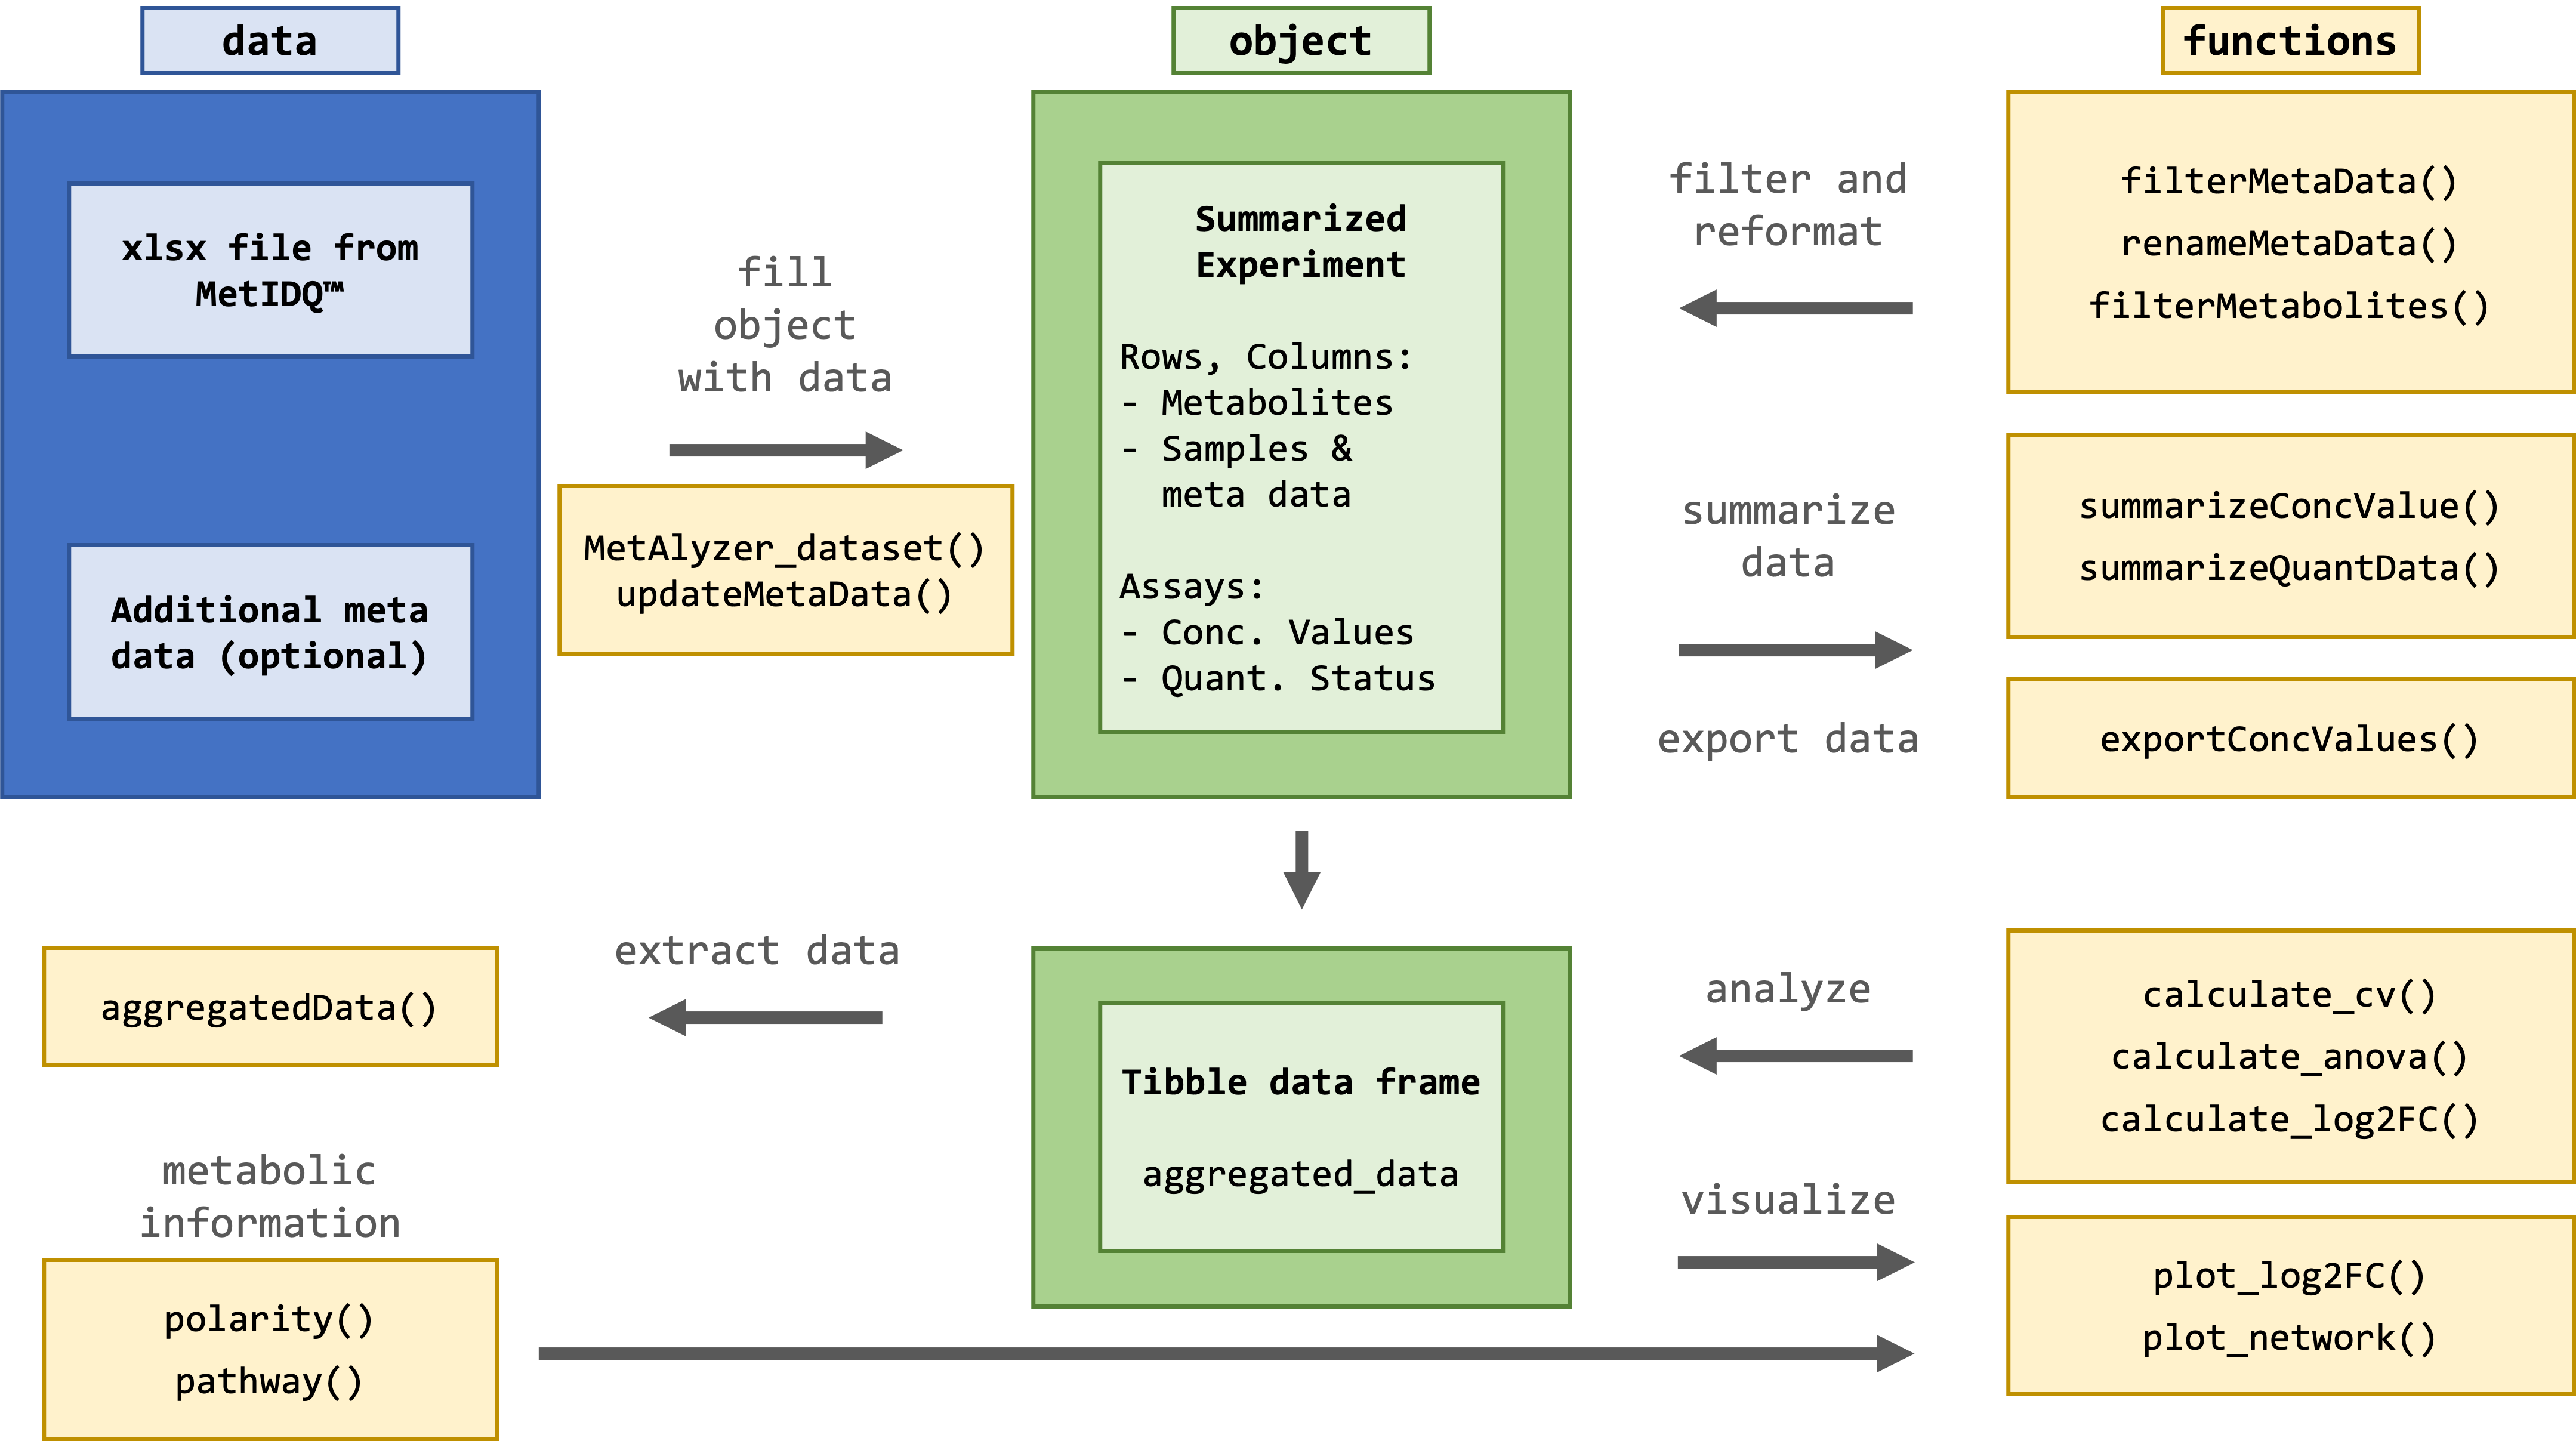
The package provides methods to read output files from the MetIDQ™ software into R. Metabolomics data is read and reformatted into an S4 object for convenient data handling, statistics and downstream analysis.
There is a version available on CRAN.
install.packages("MetAlyzer")For the latest version install from GitHub
library(devtools)
install_github("nilsmechtel/MetAlyzer")The package takes metabolomic measurements and the quantification status (e.g. “Valid”, “LOQ”, “LOD”) as “.xlsx” files generated from the MetIDQ™ software. Additionally, meta data for each sample can be provided for further analysis.
This is an extract from one of the provided example data sets. 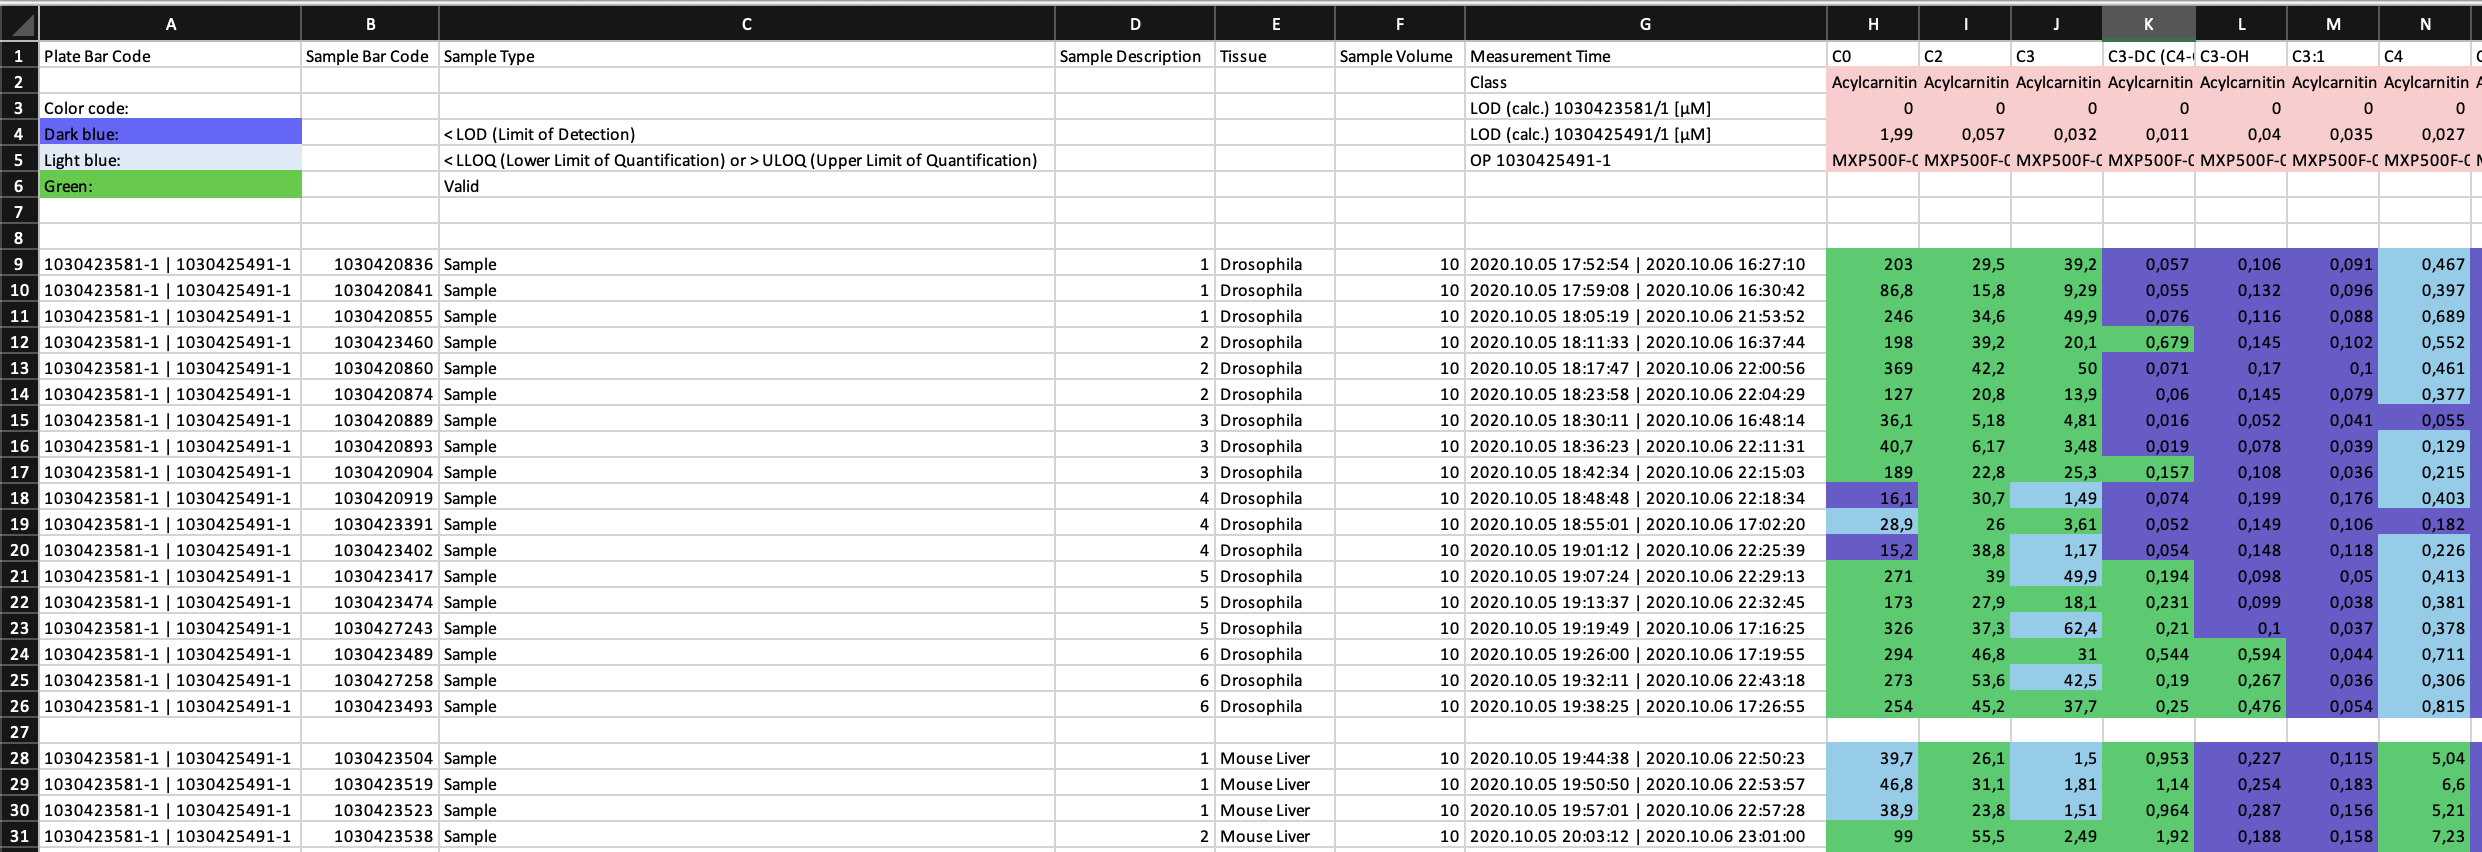
> metalyzer_se <- MetAlyzer_dataset(file_path = extraction_data())


 _____ ______   _______  _________  ________  ___           ___    ___ ________  _______   ________
|\   _ \  _   \|\  ___ \|\___   ___\\   __  \|\  \         |\  \  /  /|\_____  \|\  ___ \ |\   __  \
\ \  \\\__\ \  \ \   __/\|___ \  \_\ \  \|\  \ \  \        \ \  \/  / /\|___/  /\ \   __/|\ \  \|\  \
 \ \  \\|__| \  \ \  \_|/__  \ \  \ \ \   __  \ \  \        \ \    / /     /  / /\ \  \_|/_\ \   _  _\
  \ \  \    \ \  \ \  \_|\ \  \ \  \ \ \  \ \  \ \  \____    \/   / /     /  /_/__\ \  \_|\ \ \  \\  \|
   \ \__\    \ \__\ \_______\  \ \__\ \ \__\ \__\ \_______\__/   / /     |\________\ \_______\ \__\\ _\
    \|__|     \|__|\|_______|   \|__|  \|__|\|__|\|_______|\____/ /       \|_______|\|_______|\|__|\|__|
                                                          \|____|/


Info: Reading color code "FFFFCCCC" as "#FFCCCC"
Info: Reading color code "FF00CD66" as "#00CD66"
Info: Reading color code "FF6A5ACD" as "#6A5ACD"
Info: Reading color code "FF87CEEB" as "#87CEEB"
Info: Reading color code "FFFFFFCC" as "#FFFFCC"

Measured concentration values:
------------------------------
        0%        25%        50%        75%       100%
     0.000      0.017      1.760     21.200 288149.000

NAs: 5348 (8.38%)
Note: 'Metabolism Indicators' are frequently NA!

Measured quantification status:
-------------------------------
Valid: 24095 (37.77%)
LOQ: 5799 (9.09%)
LOD: 21789 (34.16%)
Invalid: 12105 (18.98%)
NAs: 0 (0%)For further filtering, statistical analysis and plotting, the data is reformatted and aggregated into a tibble data frame.
> aggregatedData(metalyzer_se)
# A tibble: 63,788 × 5
# Groups:   Metabolite [862]
   ID    Metabolite Class          Concentration Status
   <fct> <fct>      <fct>                  <dbl> <fct>
 1 9     C0         Acylcarnitines         203   Valid
 2 10    C0         Acylcarnitines          86.8 Valid
 3 11    C0         Acylcarnitines         246   Valid
 4 12    C0         Acylcarnitines         198   Valid
 5 13    C0         Acylcarnitines         369   Valid
 6 14    C0         Acylcarnitines         127   Valid
 7 15    C0         Acylcarnitines          36.1 Valid
 8 16    C0         Acylcarnitines          40.7 Valid
 9 17    C0         Acylcarnitines         189   Valid
10 18    C0         Acylcarnitines          16.1 LOD
# ℹ 63,778 more rows
# ℹ Use `print(n = ...)` to see more rowsFor a comprehensive tutorial, please check out the MetAlyzer Vignette.
These binaries (installable software) and packages are in development.
They may not be fully stable and should be used with caution. We make no claims about them.
Health stats visible at Monitor.