The hardware and bandwidth for this mirror is donated by dogado GmbH, the Webhosting and Full Service-Cloud Provider. Check out our Wordpress Tutorial.
If you wish to report a bug, or if you are interested in having us mirror your free-software or open-source project, please feel free to contact us at mirror[@]dogado.de.
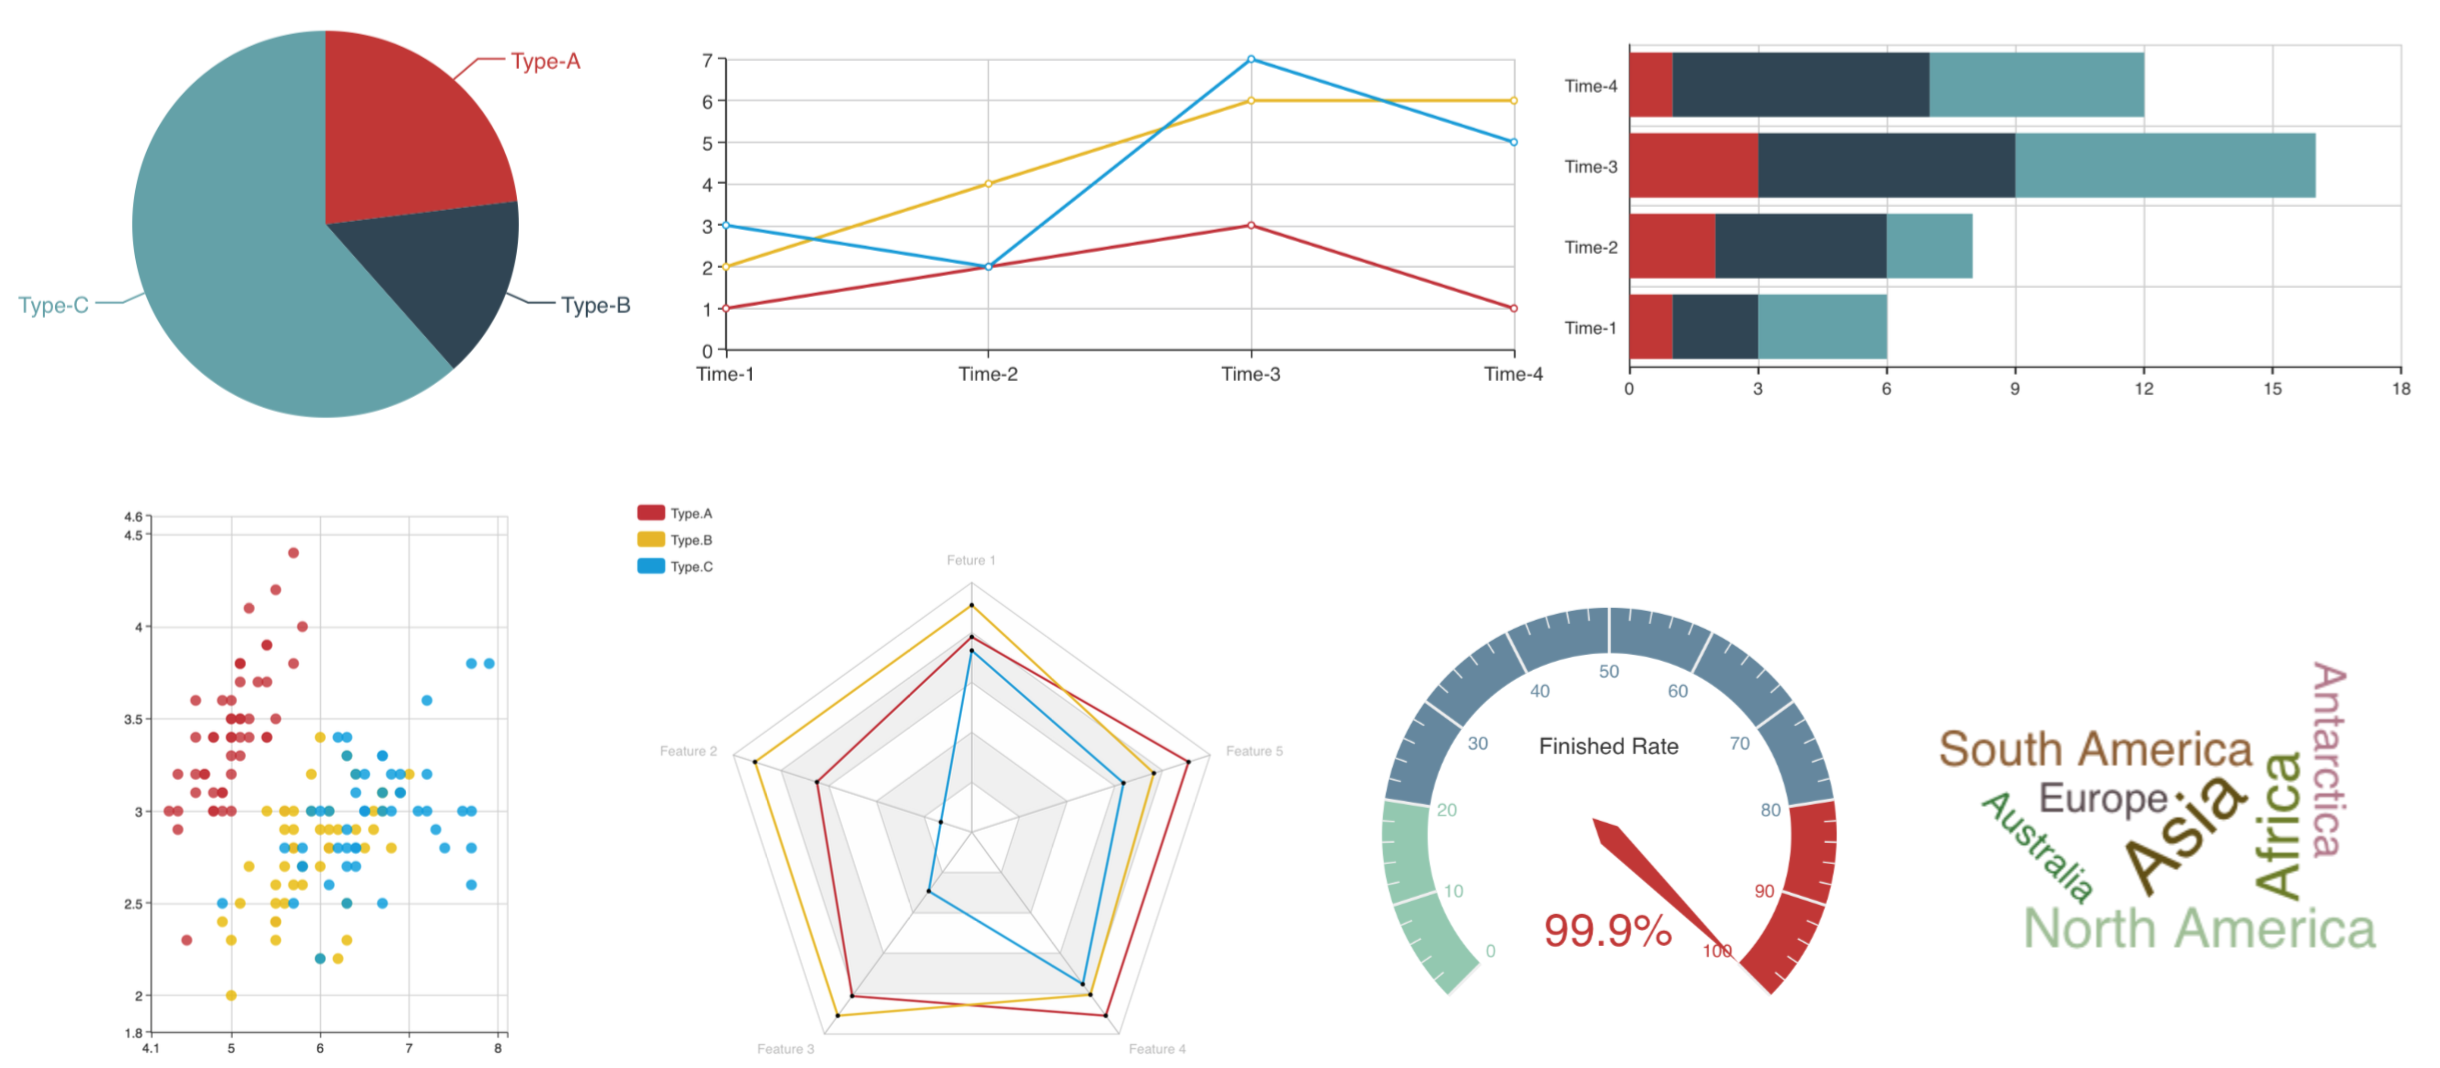

As an R package, ECharts2Shiny can help embed the interactive charts plotted by ECharts library into our Shiny application. Currently, we can support
From CRAN,
install.packages("ECharts2Shiny")For the latest development version, please install from GitHub
library(devtools)
install_github("XD-DENG/ECharts2Shiny")library(shiny)
library(ECharts2Shiny)
# Prepare sample data for plotting --------------------------
dat <- data.frame(c(1, 2, 3),
c(2, 4, 6))
names(dat) <- c("Type-A", "Type-B")
row.names(dat) <- c("Time-1", "Time-2", "Time-3")
# Server function -------------------------------------------
server <- function(input, output) {
# Call functions from ECharts2Shiny to render charts
renderBarChart(div_id = "test", grid_left = '1%', direction = "vertical",
data = dat)
}
# UI layout -------------------------------------------------
ui <- fluidPage(
# We MUST load the ECharts javascript library in advance
loadEChartsLibrary(),
tags$div(id="test", style="width:50%;height:400px;"),
deliverChart(div_id = "test")
)
# Run the application --------------------------------------
shinyApp(ui = ui, server = server)
(For more examples, please refer to the
/examples folder)
ECharts2Shiny package itself is under GPL-2.
The ECharts JS library is under BSD license (ECharts).
ECharts2Shiny作为一个R包,可以帮助在Shiny应用程序中插入由ECharts库绘出的交互图形。当前支持的图形包括
CRAN版本
install.packages("ECharts2Shiny")由GitHub安装最新开发版本
library(devtools)
install_github("XD-DENG/ECharts2Shiny")library(shiny)
library(ECharts2Shiny)
# Prepare sample data for plotting --------------------------
dat <- data.frame(c(1, 2, 3),
c(2, 4, 6))
names(dat) <- c("Type-A", "Type-B")
row.names(dat) <- c("Time-1", "Time-2", "Time-3")
# Server function -------------------------------------------
server <- function(input, output) {
# Call functions from ECharts2Shiny to render charts
renderBarChart(div_id = "test", grid_left = '1%', direction = "vertical",
data = dat)
}
# UI layout -------------------------------------------------
ui <- fluidPage(
# We MUST load the ECharts javascript library in advance
loadEChartsLibrary(),
tags$div(id="test", style="width:50%;height:400px;"),
deliverChart(div_id = "test")
)
# Run the application --------------------------------------
shinyApp(ui = ui, server = server)
(请参考/examples
文件夹以获得更多实例信息) ### 实例列表
ECharts2Shiny 包使用GLP-2许可证。
The ECharts JS库使用BSD许可证(ECharts)。
These binaries (installable software) and packages are in development.
They may not be fully stable and should be used with caution. We make no claims about them.
Health stats visible at Monitor.